Close Menu
Altcoin ObserverAltcoin Observer
  • Regulation
  • Bitcoin
  • Altcoins
  • Market
  • Analysis
  • DeFi
  • Security
  • Ethereum
Categories
  • Altcoins (3,297)
  • Analysis (3,422)
  • Bitcoin (4,038)
  • Blockchain (2,157)
  • DeFi (2,623)
  • Ethereum (2,662)
  • Event (119)
  • Exclusive Deep Dive (1)
  • Landscape Ads (2)
  • Market (2,714)
  • Press Releases (12)
  • Reddit (2,733)
  • Regulation (2,474)
  • Security (3,780)
  • Thought Leadership (3)
  • Videos (44)
Hand picked
  • U.S.-Iran Talks Emerge as Markets Parse $344M USDT Freeze
  • UK Gambling Commission publishes £65,000 job to drive out £16.6bn black market
  • BUILDon Price Rallies – Can Bitcoin’s 81% Correlation Generate More Gains?
  • Bitcoin Market Structure Continues to Improve as Bullish Shades Develop: Glassnode
  • Bernie Sanders Claims Trump Family Made $3 Billion From Crypto
We are social
  • Facebook
  • Twitter
  • Instagram
  • YouTube
Facebook X (Twitter) Instagram
  • About us
  • Disclaimer
  • Terms of service
  • Privacy policy
  • Contact us
Facebook X (Twitter) Instagram YouTube LinkedIn
Altcoin ObserverAltcoin Observer
  • Regulation
  • Bitcoin
  • Altcoins
  • Market
  • Analysis
  • DeFi
  • Security
  • Ethereum
Events
Altcoin ObserverAltcoin Observer
Home»Altcoins»Graph Gains 28% in One Week: Will Bull Domination Continue?
Altcoins

Graph Gains 28% in One Week: Will Bull Domination Continue?

September 24, 2024No Comments
Share Facebook Twitter Pinterest LinkedIn Tumblr Reddit Telegram Email
Grt Featured.webp.webp
Share
Facebook Twitter LinkedIn Pinterest Email


AvatarAvatar

Journalist

Published: September 24, 2024

  • GRT exhibits a bearish market structure on a daily basis, despite strong short-term gains.
  • Moving averages signaled that the long-term downward trend was still in effect.

The Graph token (GRT) has been performing well since last Monday. Like the rest of the cryptocurrency market, the token has seen double-digit price gains. It remains to be seen whether the bulls can defend these recent gains.

While the short-term bias has been bullish, the long-term trend has been bearish. Performance since June has favored sellers, and bulls may not yet have the strength to force a significant rally.

Chart is about to surpass August highs

The graph 1 day graphThe graph 1 day graph

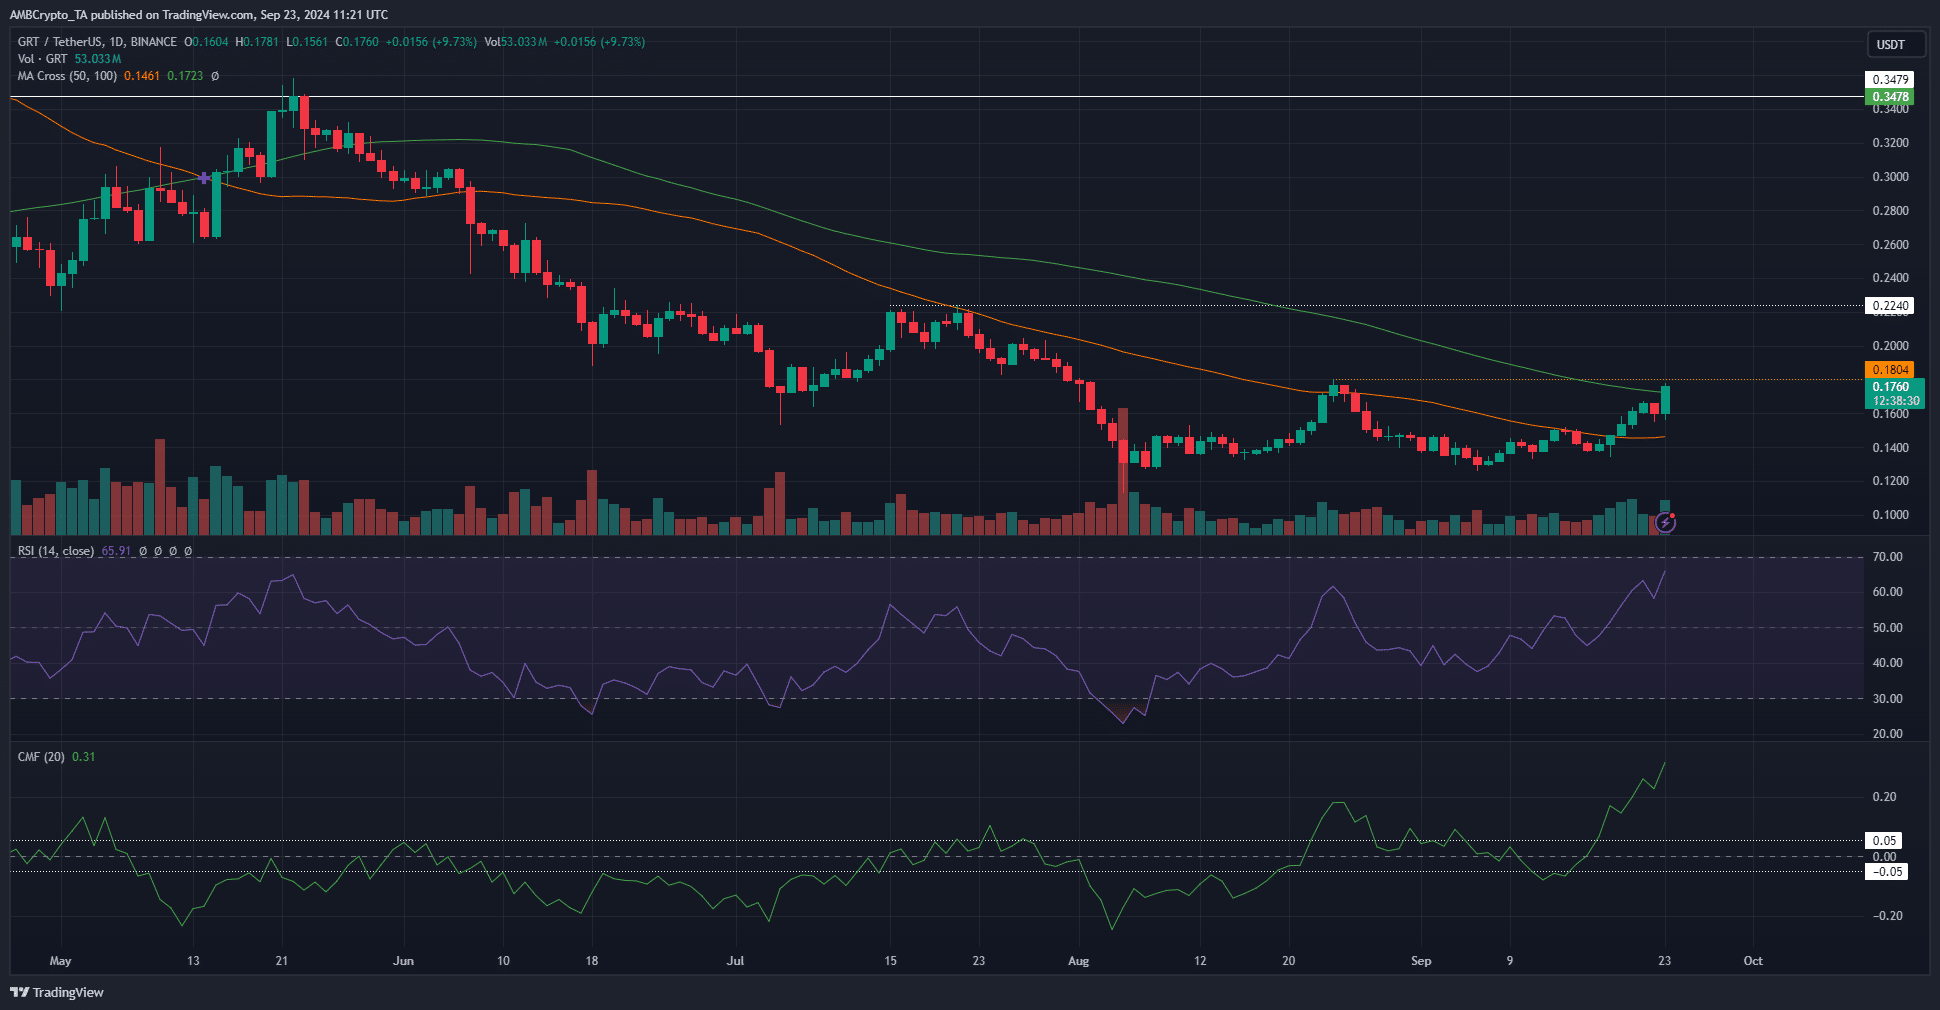
Source: GRT/USDT on TradingView

The Graph token performed well over the past week and headed towards the local resistance level at $0.18. The RSI was at 65 and has been rising since the second week of September.

This shows that the bullish momentum has strengthened. The CMF also recovered from -0.05 to reach +0.31, a value that the indicator had not seen since February.

This indicates a strong flow of capital into the GRT market, which could strengthen bullish efforts to break the $0.18 resistance.

Simple moving averages captured the essence of the downtrend. The faster 50-day moving average was still below the 100-day moving average, meaning the recent upward move needs to be sustained for a longer period of time to break the downtrend.

The lack of sales during the slight price decline was encouraging
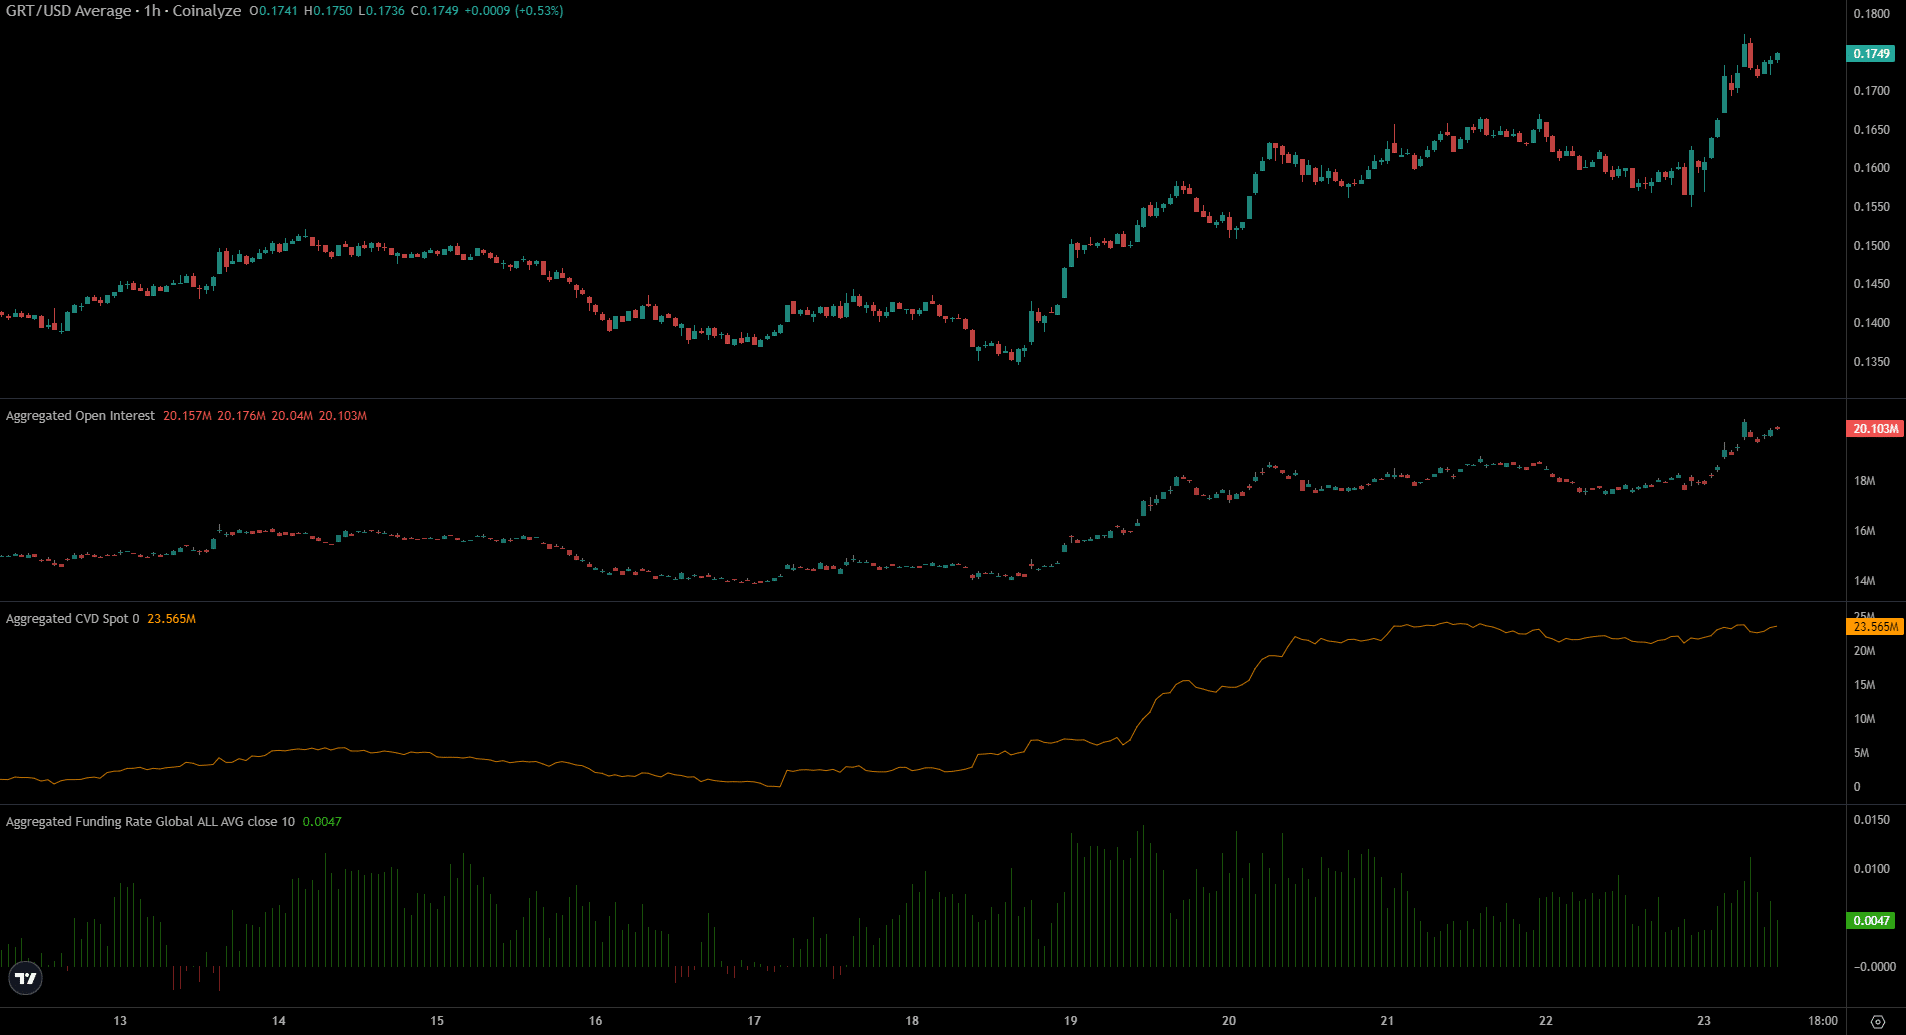
The Coinalyze chartThe Coinalyze chart

Source: Coinalyze

Over the past week, both the price and open interest have increased, indicating bullish sentiment. Speculators are eager to invest long-term on GRT. This is a market-wide phenomenon that has occurred following the resurgence of Bitcoin.


Is Your Portfolio Green? Discover The Graph Profit Calculator


Other assets saw their spot CVD remain in a sideways trend, meaning the rally was not supported by spot demand.

The Graph token has seen strong demand in recent days and low selling pressure. The funding rate was also positive.

Disclaimer: The information presented does not constitute financial, investment, trading or other types of advice and represents the opinion of the author only.

Next: Will BNB Finally Break $600 as CZ Returns This Week?


Source link

Share. Facebook Twitter Pinterest LinkedIn Tumblr Email
Previous ArticleMTT Sports participates as Platinum Sponsor at Token 2049 Singapore and launches “One Week, One Bitcoin” initiative
Next Article Sygnum obtains license in Liechtenstein to expand its crypto services in the EU

Related Posts

Altcoins

BUILDon Price Rallies – Can Bitcoin’s 81% Correlation Generate More Gains?

May 12, 2026
Altcoins

Can MORPHO overtake Aave after its TVL soars to $11.78 billion?

May 12, 2026
Altcoins

Scaramucci warns of CLARITY Act delay amid banking pushback

May 11, 2026
Add A Comment
Leave A Reply Cancel Reply

Single Page Post
Share
  • Facebook
  • Twitter
  • Instagram
  • YouTube
Featured Content
Event

Dutch Blockchain Week 2026 strengthens position as Europe’s leading B2B blockchain event week

April 14, 2026

Amsterdam, April 2026 – Dutch Blockchain Week 2026 is rapidly evolving into one of Europe’s…

Event

Global Games Show Riyadh: The Ultimate Creator & Influencer Hub

March 31, 2026

The fast-evolving gaming ecosystem of Riyadh is powered by solid national investment, a flourishing esports…

1 2 3 … 82 Next
  • Facebook
  • Twitter
  • Instagram
  • YouTube

BUILDon Price Rallies – Can Bitcoin’s 81% Correlation Generate More Gains?

May 12, 2026

Can MORPHO overtake Aave after its TVL soars to $11.78 billion?

May 12, 2026

Scaramucci warns of CLARITY Act delay amid banking pushback

May 11, 2026
Facebook X (Twitter) Instagram LinkedIn
  • About us
  • Disclaimer
  • Terms of service
  • Privacy policy
  • Contact us
© 2026 Altcoin Observer. all rights reserved by Tech Team.

Type above and press Enter to search. Press Esc to cancel.

bitcoin
Bitcoin (BTC) $ 80,751.00
ethereum
Ethereum (ETH) $ 2,283.56
tether
Tether (USDT) $ 0.999557
xrp
XRP (XRP) $ 1.46
bnb
BNB (BNB) $ 658.86
usd-coin
USDC (USDC) $ 0.999698
solana
Solana (SOL) $ 95.44
tron
TRON (TRX) $ 0.349382
figure-heloc
Figure Heloc (FIGR_HELOC) $ 1.03
staked-ether
Lido Staked Ether (STETH) $ 2,265.05