




Close Menu
Altcoin ObserverAltcoin Observer
  • Regulation
  • Bitcoin
  • Altcoins
  • Market
  • Analysis
  • DeFi
  • Security
  • Ethereum
Categories
  • Altcoins (3,732)
  • Analysis (3,840)
  • Bitcoin (4,470)
  • Blockchain (2,157)
  • DeFi (2,623)
  • Ethereum (2,773)
  • Event (119)
  • Exclusive Deep Dive (1)
  • Landscape Ads (2)
  • Market (2,714)
  • Press Releases (12)
  • Reddit (2,847)
  • Regulation (2,474)
  • Security (4,103)
  • Thought Leadership (3)
  • Videos (44)
Hand picked
  • Uniswap RFC explores running private exchanges using v4 and UniswapX hooks
  • Australia targets Telegram a day after Russia indicts Durov
  • Bitcoin’s weak hands fold
  • Success Story: Jonathan Nichols’ Learning Journey with 101 Blockchains
  • Kraken Cyprus honored at the 14th Invest Cyprus International Investment Awards
We are social
  • Facebook
  • Twitter
  • Instagram
  • YouTube
Facebook X (Twitter) Instagram
  • About us
  • Disclaimer
  • Terms of service
  • Privacy policy
  • Contact us
Facebook X (Twitter) Instagram YouTube LinkedIn
Altcoin ObserverAltcoin Observer
  • Regulation
  • Bitcoin
  • Altcoins
  • Market
  • Analysis
  • DeFi
  • Security
  • Ethereum
Events
Altcoin ObserverAltcoin Observer
Home»Analysis»Historical data shows how many days remain until Bitcoin price hits a new ATH above $120,000
Analysis

Historical data shows how many days remain until Bitcoin price hits a new ATH above $120,000

May 19, 2026No Comments
Share Facebook Twitter Pinterest LinkedIn Tumblr Reddit Telegram Email
Share
Facebook Twitter LinkedIn Pinterest Email


Crypto analyst Cyclop has provided insight into when Bitcoin price could hit a new all-time high (ATH) above $120,000. This came as the analyst hinted at historical data indicating that BTC may be hitting bottom. this bear cycle by the last quarter of this year.

Analyst Reveals When Bitcoin Price Will Reach New ATH Based on Historical Data

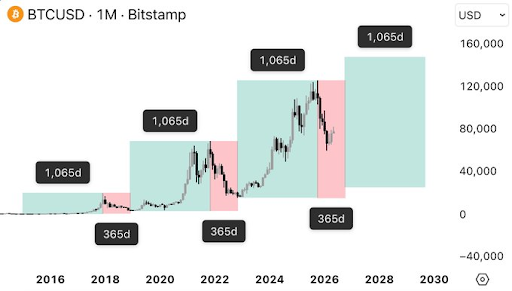
In a MessageCyclop alluded to historical BTC cycles to show when the price of Bitcoin will reach a new all-time high. He noted that between 2015 and 2017, BTC saw an increase for 1,065 days, while between 2017 and 2018, it took 365 days for BTC to reach its lowest level. the bear market. Similarly, BTC saw another surge lasting 1,065 days between 2018 and 2021 before entering a bear market that lasted 365 days.

Related reading

Additionally, between 2022 and 2025, the price of Bitcoin experienced another bull run lasting 1,065 days, with BTC reaching an ATH of 126,000. The leading crypto then peaked in October 2025 and has been in a bear market ever since. Based on this historical data, BTC could be on track to remain in this bear market until October 5, which will complete the 365-day cycle.
Bitcoin
Source: Cyclop’s chart on X

The analyst’s attached chart shows that Bitcoin price could rally back to between $140,000 and $150,000 during the next bull run before the leading crypto peaks in 2030 and enters another bear market. Meanwhile, this historical data suggests that Bitcoin’s bottom is not reached, despite The recent BTC rally above $80,000. Bitcoin is once again in a downtrend amid inflation concerns and fears that war between the United States and Iran will begin soon after peace talks stalled.

The local BTC summit is here

Crypto analyst Colin said as Bitcoin price hits a local high, with BTC now eyeing new lows. He noted how bearish the current price action is as the leading crypto has rejected the upper channel of a trendline, the Moving average of 200and below the trend line. This setback has repeatedly been respected as both resistance and support, but has now shifted to the downside.

Related reading

In another MessageColin echoed Cyclop’s sentiments, noting that on a purely temporal basis, it is extremely unlikely that BTC borrowing would have occurred just after four months, since the Bitcoin price peaked last October. The analyst previously said that BTC could hit bottom around $40,000 based on historical data, as the lowest decline the crypto asset has ever suffered in a bear market is 77%. Meanwhile, Bitcoin only saw a 53% decline to reach the February 2026 low of $60,000.

At the time of writing, the Bitcoin price is trading at around $76,600, down over the past 24 hours, according to data from CoinMarketCap.

Bitcoin
BTC trades at $77,209 on 1D chart | Source: BTCUSDT on Tradingview.com

Featured image from Getty Images, chart from Tradingview.com


Source link

Share. Facebook Twitter Pinterest LinkedIn Tumblr Email
Previous ArticleBitMart Launches Prepaid Wallet Card to Integrate Crypto Assets into Everyday Spending
Next Article The lighter jumps by 11% – But 2 major factors play in LIT’s place

Related Posts

Analysis

Bitcoin’s weak hands fold

July 30, 2026
Analysis

CLARITY Act Delay Shows Fight Against Crypto Market Structure Is Not Over

July 30, 2026
Analysis

CLARITY Act delay risks taking US lead on crypto, lawmaker warns

July 28, 2026
Add A Comment
Leave A Reply Cancel Reply

Single Page Post
Share
  • Facebook
  • Twitter
  • Instagram
  • YouTube
Featured Content
Event

Dutch Blockchain Week 2026 strengthens position as Europe’s leading B2B blockchain event week

April 14, 2026

Amsterdam, April 2026 – Dutch Blockchain Week 2026 is rapidly evolving into one of Europe’s…

Event

Global Games Show Riyadh: The Ultimate Creator & Influencer Hub

March 31, 2026

The fast-evolving gaming ecosystem of Riyadh is powered by solid national investment, a flourishing esports…

1 2 3 … 82 Next
  • Facebook
  • Twitter
  • Instagram
  • YouTube

Australia targets Telegram a day after Russia indicts Durov

July 30, 2026

Ethena whales withdraw 102 million tokens from exchanges: has ENA selling pressure eased?

July 30, 2026

Audiera loses KEY support – can BEAT recover from 24% crash?

July 29, 2026
Facebook X (Twitter) Instagram LinkedIn
  • About us
  • Disclaimer
  • Terms of service
  • Privacy policy
  • Contact us
© 2026 Altcoin Observer. all rights reserved by Tech Team.

Type above and press Enter to search. Press Esc to cancel.

bitcoin
Bitcoin (BTC) $ 77,484.00
ethereum
Ethereum (ETH) $ 2,451.51
tether
Tether (USDT) $ 0.999901
xrp
XRP (XRP) $ 1.50
bnb
BNB (BNB) $ 700.81
usd-coin
USDC (USDC) $ 0.999933
solana
Solana (SOL) $ 94.86
tron
TRON (TRX) $ 0.343541
hyperliquid
Hyperliquid (HYPE) $ 81.32
figure-heloc
Figure Heloc (FIGR_HELOC) $ 1.00