



Bitcoin is trading around $71,000 as global markets enter a cautious hold pattern. Investors are closely watching how the recently announced ceasefire between the United States and Iran holds and how its resolution could affect overall risk sentiment.
Until there is greater geopolitical clarity, crypto markets appear content to consolidate rather than engage in directional evolution.
Bitcoin price analysis: the daily chart
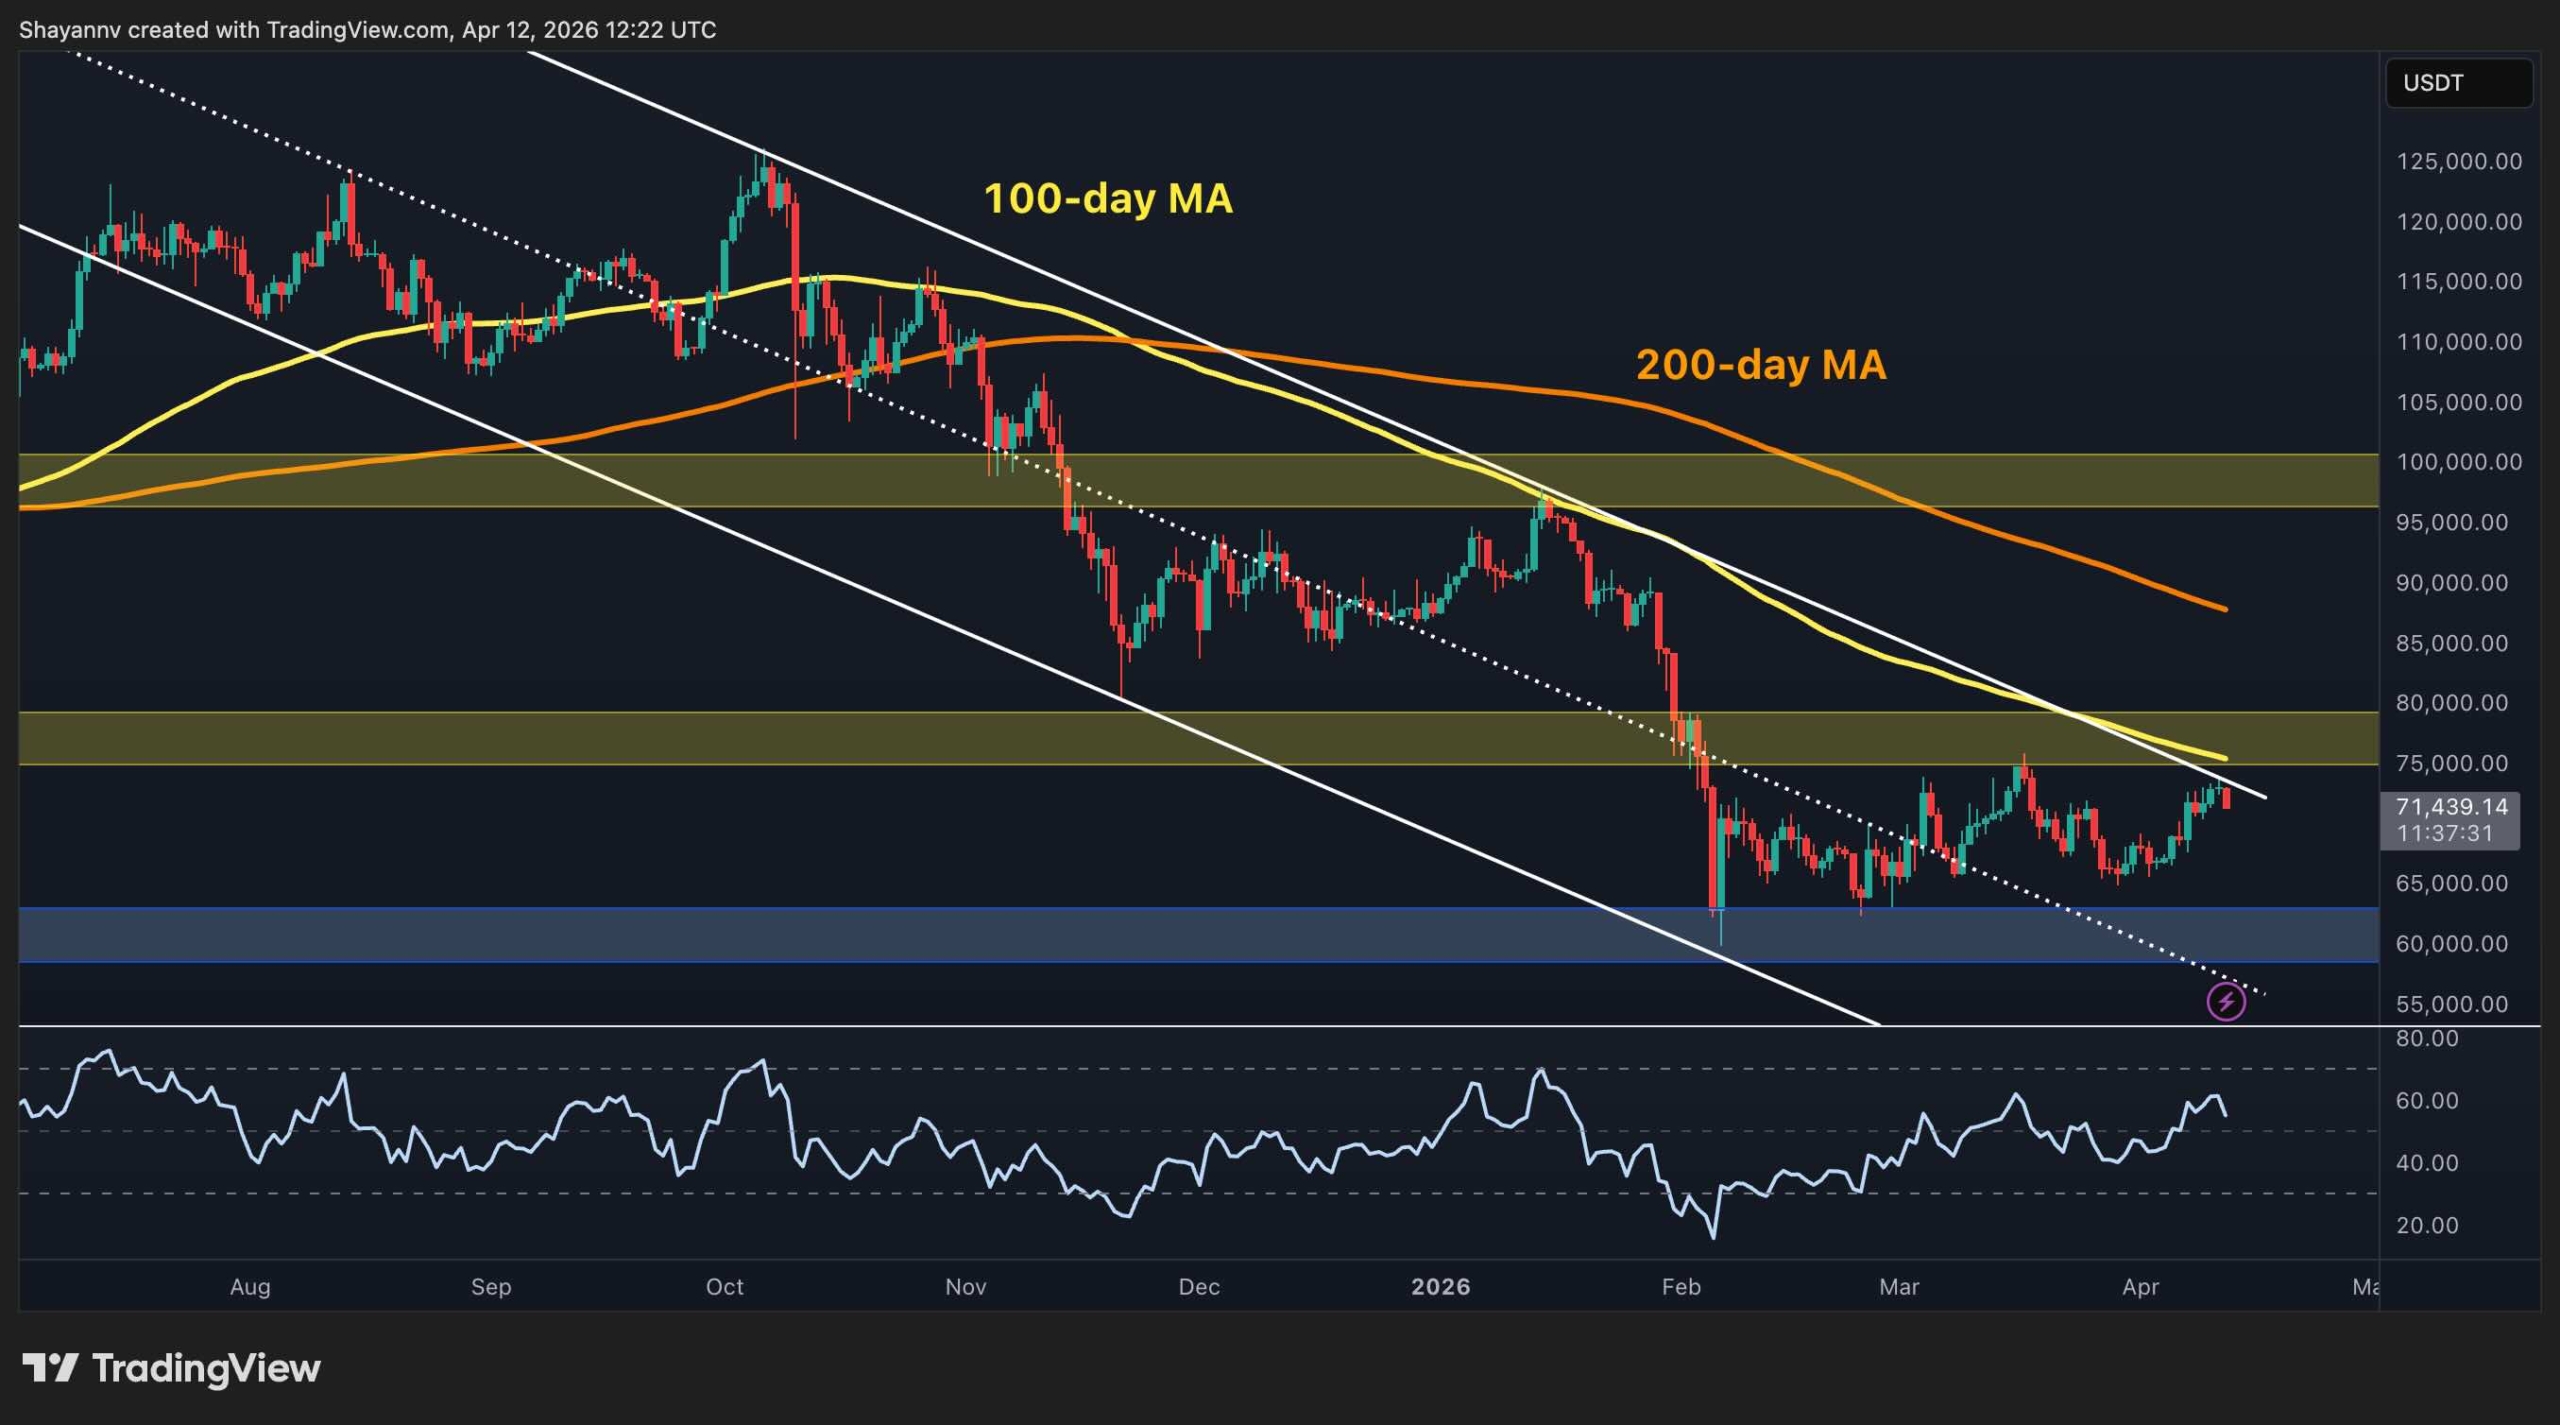
The daily chart continues to show a long-term bearish trend. BTC is trading within a descending channel and below the 100-day MA (~$75,000) and the 200-day MA (~$87,000). The resistance band at $75,000 to $80,000 remains the main ceiling as it has rejected all recovery attempts since the February crash. Both moving averages are also falling, indicating that the overall trend has not yet reversed.
That said, the RSI has been trending higher since the February lows and is now above 50. This indicates that the momentum is still dominated by buyers, but only marginally. The support zone at $60,000 continues to be the most important level for buyers to defend as a breakdown could push the price towards the $55,000 zone. On the other hand, a push above $75,000 to $80,000 on heavy volume would be the first significant signal of a trend change.
BTC/USDT 4-hour chart
The short-term ascending channel that formed from the February lows remains the dominant structure on the 4-hour chart, with the asset currently at $71,000. The $74,000-$76,000 area recently rejected the downside, and the market is at risk of returning to the lower boundary of the pattern, currently around $67,000.
The RSI over this time frame, however, has fallen significantly and is now below 50. While it is still not deep in bearish territory, this suggests a potential near-term shift in momentum toward a downtrend.
A confirmed close above $75,000 would invalidate the bearish scenario and lead the price to rally towards the $80,000 level. On the other hand, a larger decline and break below the lower trendline would be more concerning and could refocus attention on the $60,000 daily support zone.
On-Chain Analysis
The adjusted SOPR (aSOPR) currently prints values below 1.00 – a level that indicates that coins are, overall, being spent at a loss. What makes the current reading particularly striking is that the aSOPR 30-day EMA has fallen to levels last seen when Bitcoin was trading around $25,000 during the latter stages of the previous bear market.
In other words, the behavior of on-chain realized losses at current prices reflects the intensity of capitulation seen at cycle lows nearly three years ago, at a fraction of the price.
Historically, sustained aSOPR readings below 1.00, especially when the EMA confirms the trend, have marked late capitulation phases rather than the start of new downtrends. However, given the overall geopolitical and economic environment, this does not guarantee that a reversal is imminent, but it does suggest that sellers may become exhausted at these levels, which is what analysts want to see a bottom form.
Binance Free $600 (CryptoPotato Exclusive): Use this link to create a new account and receive an exclusive $600 welcome offer on Binance (all details).
LIMITED OFFER for CryptoPotato readers at Bybit: Use this link to sign up and open a FREE $500 position on any coin!
Disclaimer: Information found on CryptoPotato is that of the cited authors. It does not represent the opinions of CryptoPotato on whether to buy, sell or hold any investments. You are advised to carry out your own research before making any investment decision. Use the information provided at your own risk. See Disclaimer for more information.


