


Bitcoin price has been between $77,899 and $80,339 for weeks. Retail sees a dead chart. But historically, this type of BTC consolidation is exactly when the altcoin starts moving and begins its season.
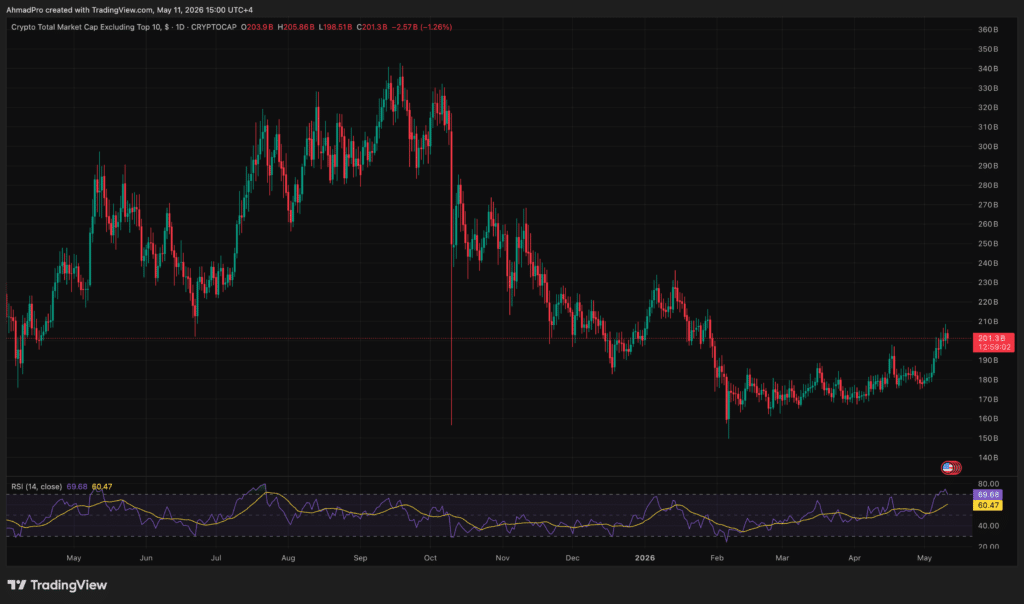
The mechanism is called crypto capital rotation. The total crypto market constitutes a single pool of money. When Bitcoin goes up, everyone piles in first. When it stops, that same capital begins to seek better returns on the risk curve, Ethereum first, then mid-caps, then smaller altcoins.
The signal that the rotation is starting is Bitcoin Dominance. When it peaks and begins to decline while the overall market cap holds or increases, money actively leaves BTC. Data from early May 2026 shows exactly that, with Ethereum and Solana-based ETF volumes increasing as institutions seek returns beyond Bitcoin.
This model has a precedent. At the end of 2021, Bitcoin held above $50,000 for about 6 months, sideways. The altcoin’s market cap surged by around 1,200% in the following quarter.
The plateau was not a dead market. It was a launching pad. Jim Ferraioli of Schwab Crypto Research notes that the $78,000 to $83,000 range is almost exactly the average cost basis for active BTC traders and spot ETF investors. This concentration of break-even sellers is what is slowing Bitcoin’s rise and historically redirecting attention to alts.
DISCOVER: The best Meme Coin ICOs to invest in 2026
On-Chain Data Indicates 2026 Altcoin Season Is Already Loading
Active Bitcoin addresses hit a 12-month low of 660,000 in early May 2026 and miner revenues fell 20% to around $40 million per day. The removal of one-time buyers is the classic rotation setup.
MEXC Research reported that institutional traders held 63% short positions in Bitcoin as of early May, while retail long exposure stood at just 35.7%. Institutions are not positioned for an immediate BTC surge, and retail has not followed suit either.
This creates a coil spring. Either BTC reduces short positions to $85,677 or retests the $71,000-$73,000 support. Regardless, the broader thesis of the alternate season doesn’t change. ETF flows remain favorable, FX balances are declining and larger portfolios are accumulating due to volatility.
Where does the money go from here
If Bitcoin clears $80,297 on daily volume above 40,000 BTC, short liquidations push the price towards $85,677 and dominance falls as capital flows into Ethereum and mid-cap alts. Strong altcoins see 2x to 5x movements in this environment.
If Bitcoin earns between $78,000 and $82,000 for a few more weeks, the rotation will proceed slowly. Ethereum and Solana ETF volumes are steadily increasing while BTC dominance slowly fades. The May 14 FOMC minutes are the wild card that could break the range in either direction.
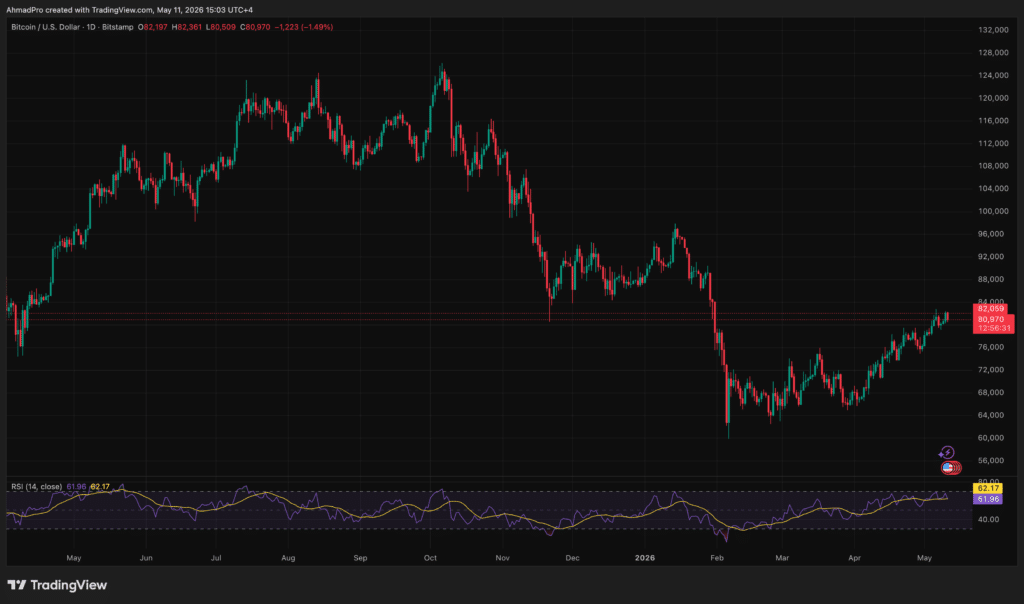
Lose $78,000 and Bitcoin retests the $71,000-$73,000 support. Alts are selling harder than BTC. This cost-based group constitutes the critical line. An extended break below shifts the narrative from consolidation to distribution.
Even in the best case scenario, Bitcoin going from $80,000 to $96,000 represents an upside of around 20%. Pale compared to what altcoins historically offer during rotation phases. This gap is what attracts capital to early-stage projects when BTC is limited. Higher risk, higher upside potential, and position sizes are more important here than anywhere else in crypto.
Bitcoin’s stagnation at $80,000 is not a warning. For anyone who understands capital turnover, this is a signal to watch for what happens next.
DISCOVER: The Best Solana Meme Coins to Buy in 2026
Follow 99Bitcoins on X For latest market updates and subscribe on YouTube For daily market analysis from experts.
The post Is “Altcoin Season” Finally Here? Why Bitcoin’s $80,000 Stagnation Is Good News appeared first on 99Bitcoins.