


LAB recorded one of its biggest daily declines after losing 32.45% in the last 24 hours, bringing its price down to $7.16.
Despite the massive sales, trading activity accelerated rather than weakened.
Daily trading volume soared 45.77% to over $660 million, showing that market participants continued to take positions throughout the decline.
The increase in volume during a sharp decline suggests that traders have been actively repositioning rather than exiting the market altogether.
Such conditions often reflect increased speculation, with buyers attempting to identify value while sellers continue to defend lower levels.
As a result, participation remained high even after LABORATORY revisited prices last seen before its last rally.
Why have leveraged traders increased their exposure?
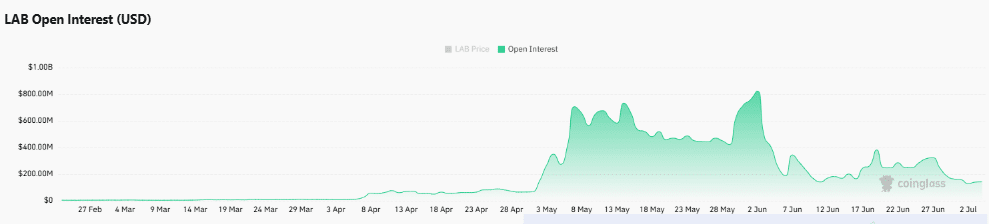
Activity on derivative products also strengthened despite the strong correction.
Open interest (OI) rose 83.74% to $223.53 million even as LAB extended its decline, indicating that new leveraged positions entered the market instead of widespread position closures.
This combination generally reflects increasing speculative participation, with both bulls and bears increasing their exposure during times of increased volatility.
However, rising OI alongside falling prices generally indicates that new short positions likely contributed to the broader decline. This change also indicates that traders were expecting another large move rather than a prolonged consolidation phase.
Until leverage begins to reduce, price swings could likely remain high.
However, the sustained growth in OI showed that traders continued to commit new capital despite the recent collapse, underscoring confidence that another directional move could soon emerge.
Could shorts trigger a rebound?
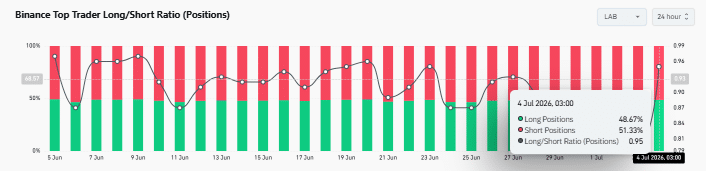
Professional traders maintained a slight bullish bias despite the sharp correction in LAB.
The best trader on Binance Long/short ratio showed that 51.33% of positions remained long, while 48.67% remained short, indicating that experienced participants had not completely abandoned bullish exposure.
Meanwhile, the continued increase in OI suggests that aggressive short positions were also introduced after the breakout towards the $6.02 support zone.
Such positioning often created dense pockets of leveraged shorts near local funds.
If LAB defends its current support, even a modest rally could force short sellers to close their positions quickly, adding buying pressure via liquidations.
However, this scenario would represent a counter-trend squeeze rather than a confirmed reversal.
Can LAB defend its support after the collapse?
LAB attempted to stabilize above the $6.02 support after rebounding from an intraday low near $5.82.
Buyers pushed the price above support, although the recovery remained limited.
The relative strength index (RSI) fell to 41.15, reflecting an easing of selling pressure without entering oversold territory. This reading suggests that sellers have lost some momentum, even if buyers have not completely regained control.
The chart identifies $11.86 as the nearest resistance, while $20.00 remains the next major recovery target if demand strengthens.
If LAB continues to hold above $6.02, crowded short positioning could fuel counter-trend pressure towards higher resistance.
However, losing this support would likely expose the token to another round of selling before a sustainable recovery develops.
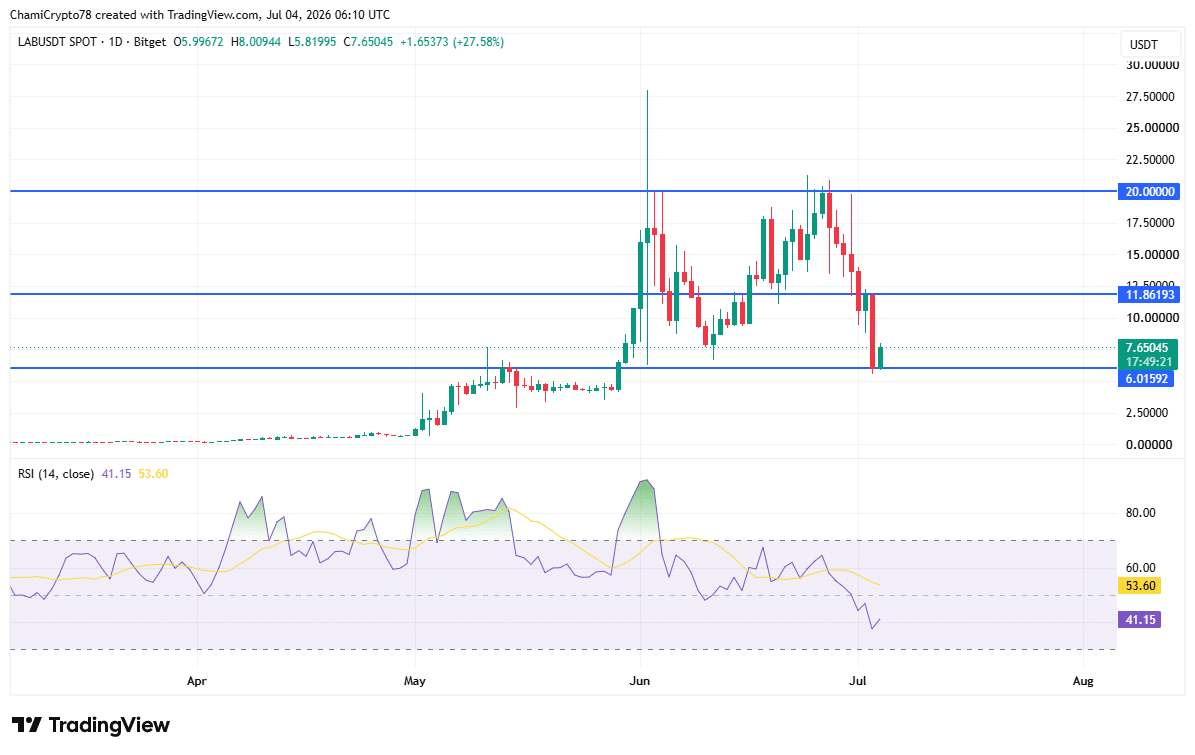
Source: TradingView
Final summary
- LAB attracted new leveraged positions despite the sharp decline, thus keeping volatility high.
- Crowded shorts near support could accelerate a relief rally if buyers defend current levels.