




- ETH has found critical support at key levels.
- The growth of the network has shown the appearance of more ETH addresses.
Ethereum (ETH) price finds strong support between $3,700 and $3,810, where 3 million addresses have accumulated 4.6 million ETH. This critical accumulation zone reflects growing investor confidence and provides protection against possible downward pressure.
With strong supply-demand dynamics and key Fibonacci levels pointing towards $5,000 as a plausible target, Ethereum’s bullish case continues to strengthen.
Support Levels and Accumulation Zones
Ethereum price trajectory analysis reveals a robust demand zone between $3,700 and $3,810. According to data from IntoTheBlock, around three million addresses have accumulated 4.6 million ETH in this price range.
Analysis has shown that this level appears to be a critical support zone, providing a cushion against possible bearish pressure. The strong accumulation here reflects investor confidence and hints at the possibility of sustained upward momentum.
Ethereum Network Growth Reaches New Heights
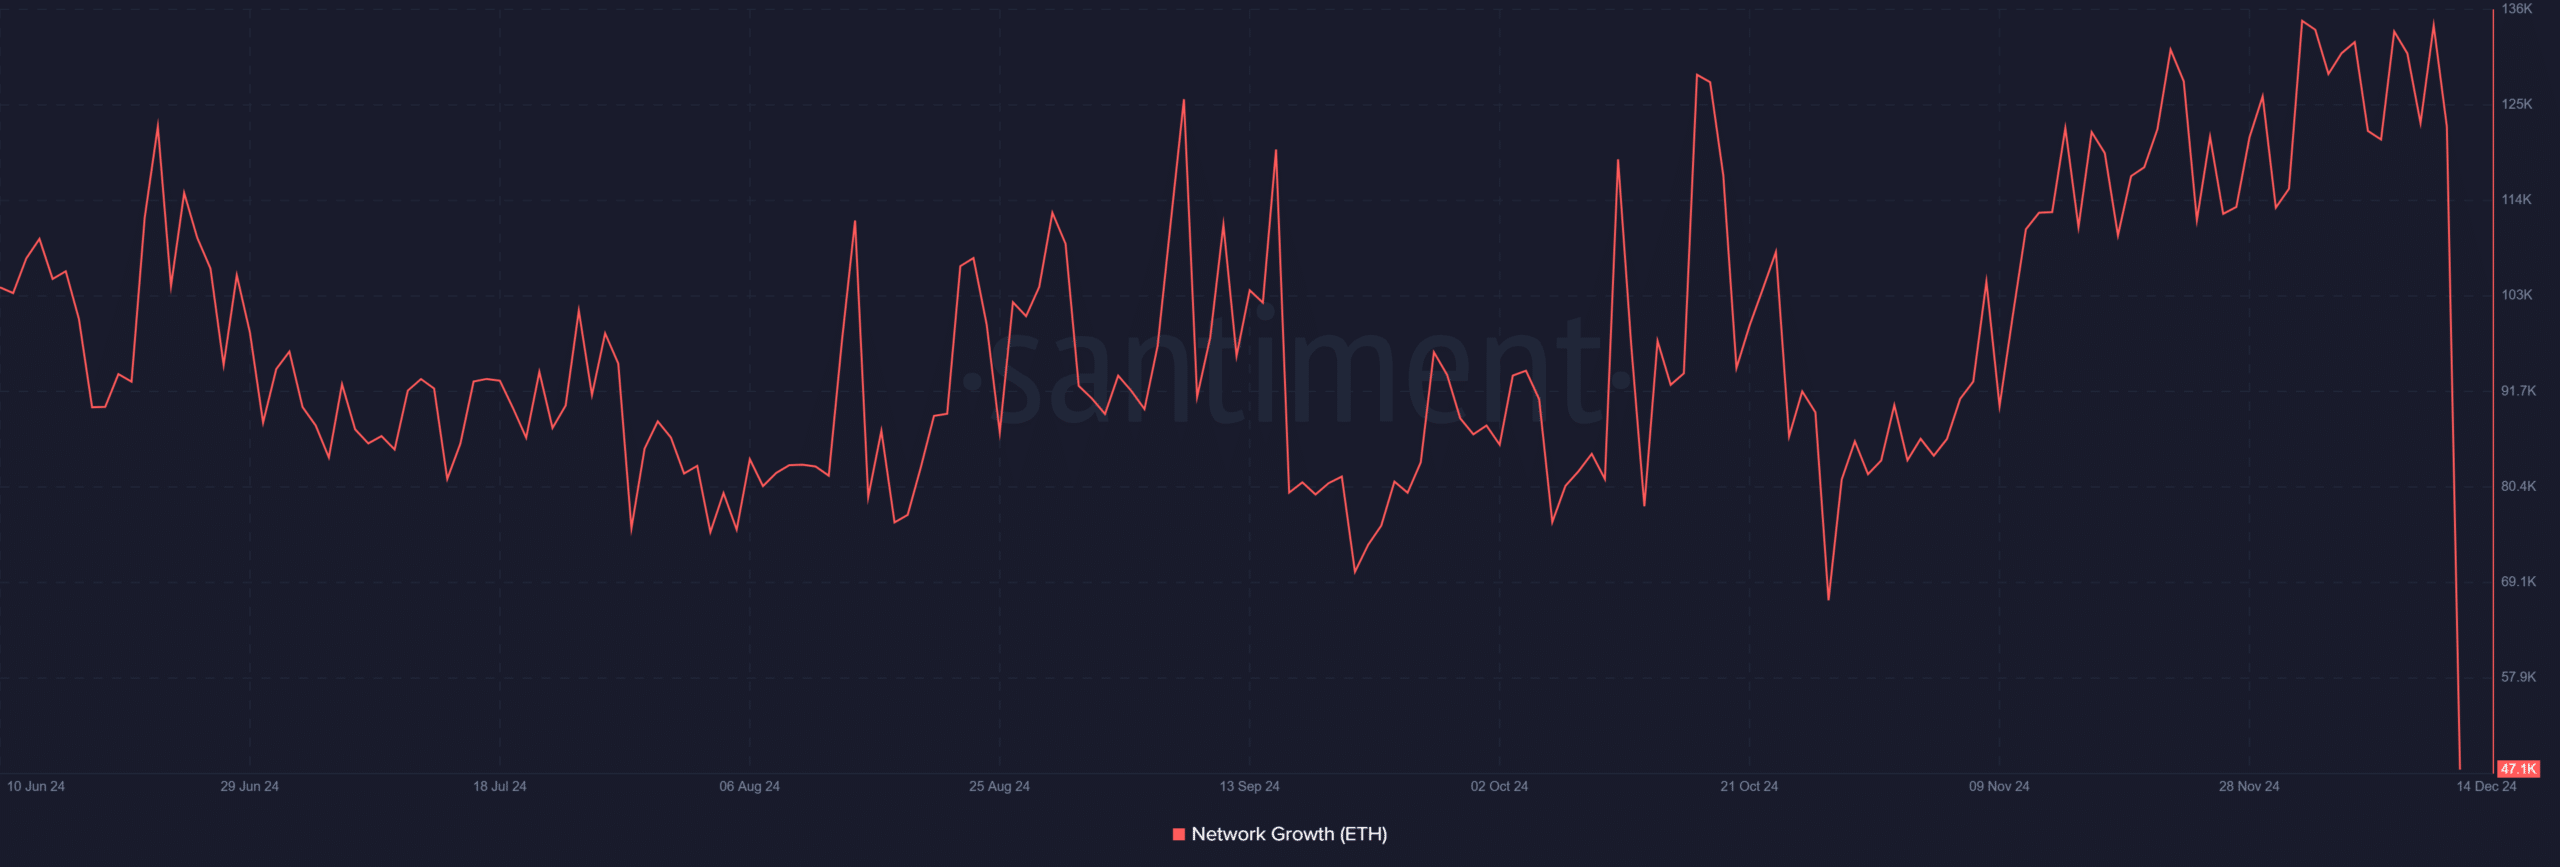
According to an analysis of the growth of the Ethereum network on Santiment, there has been a significant increase. The analysis showed an average of 130,200 new wallets created daily in December.
This is an 8-month high, indicating renewed interest in ETH as it attracts attention from retail and institutional participants.
Source: Santiment
Additionally, this increase in wallet creation suggests that Ethereum network activity is expanding, reinforcing the idea of a growing user base and increased transactional activity.
The upper band of the realized price signals bullish potential
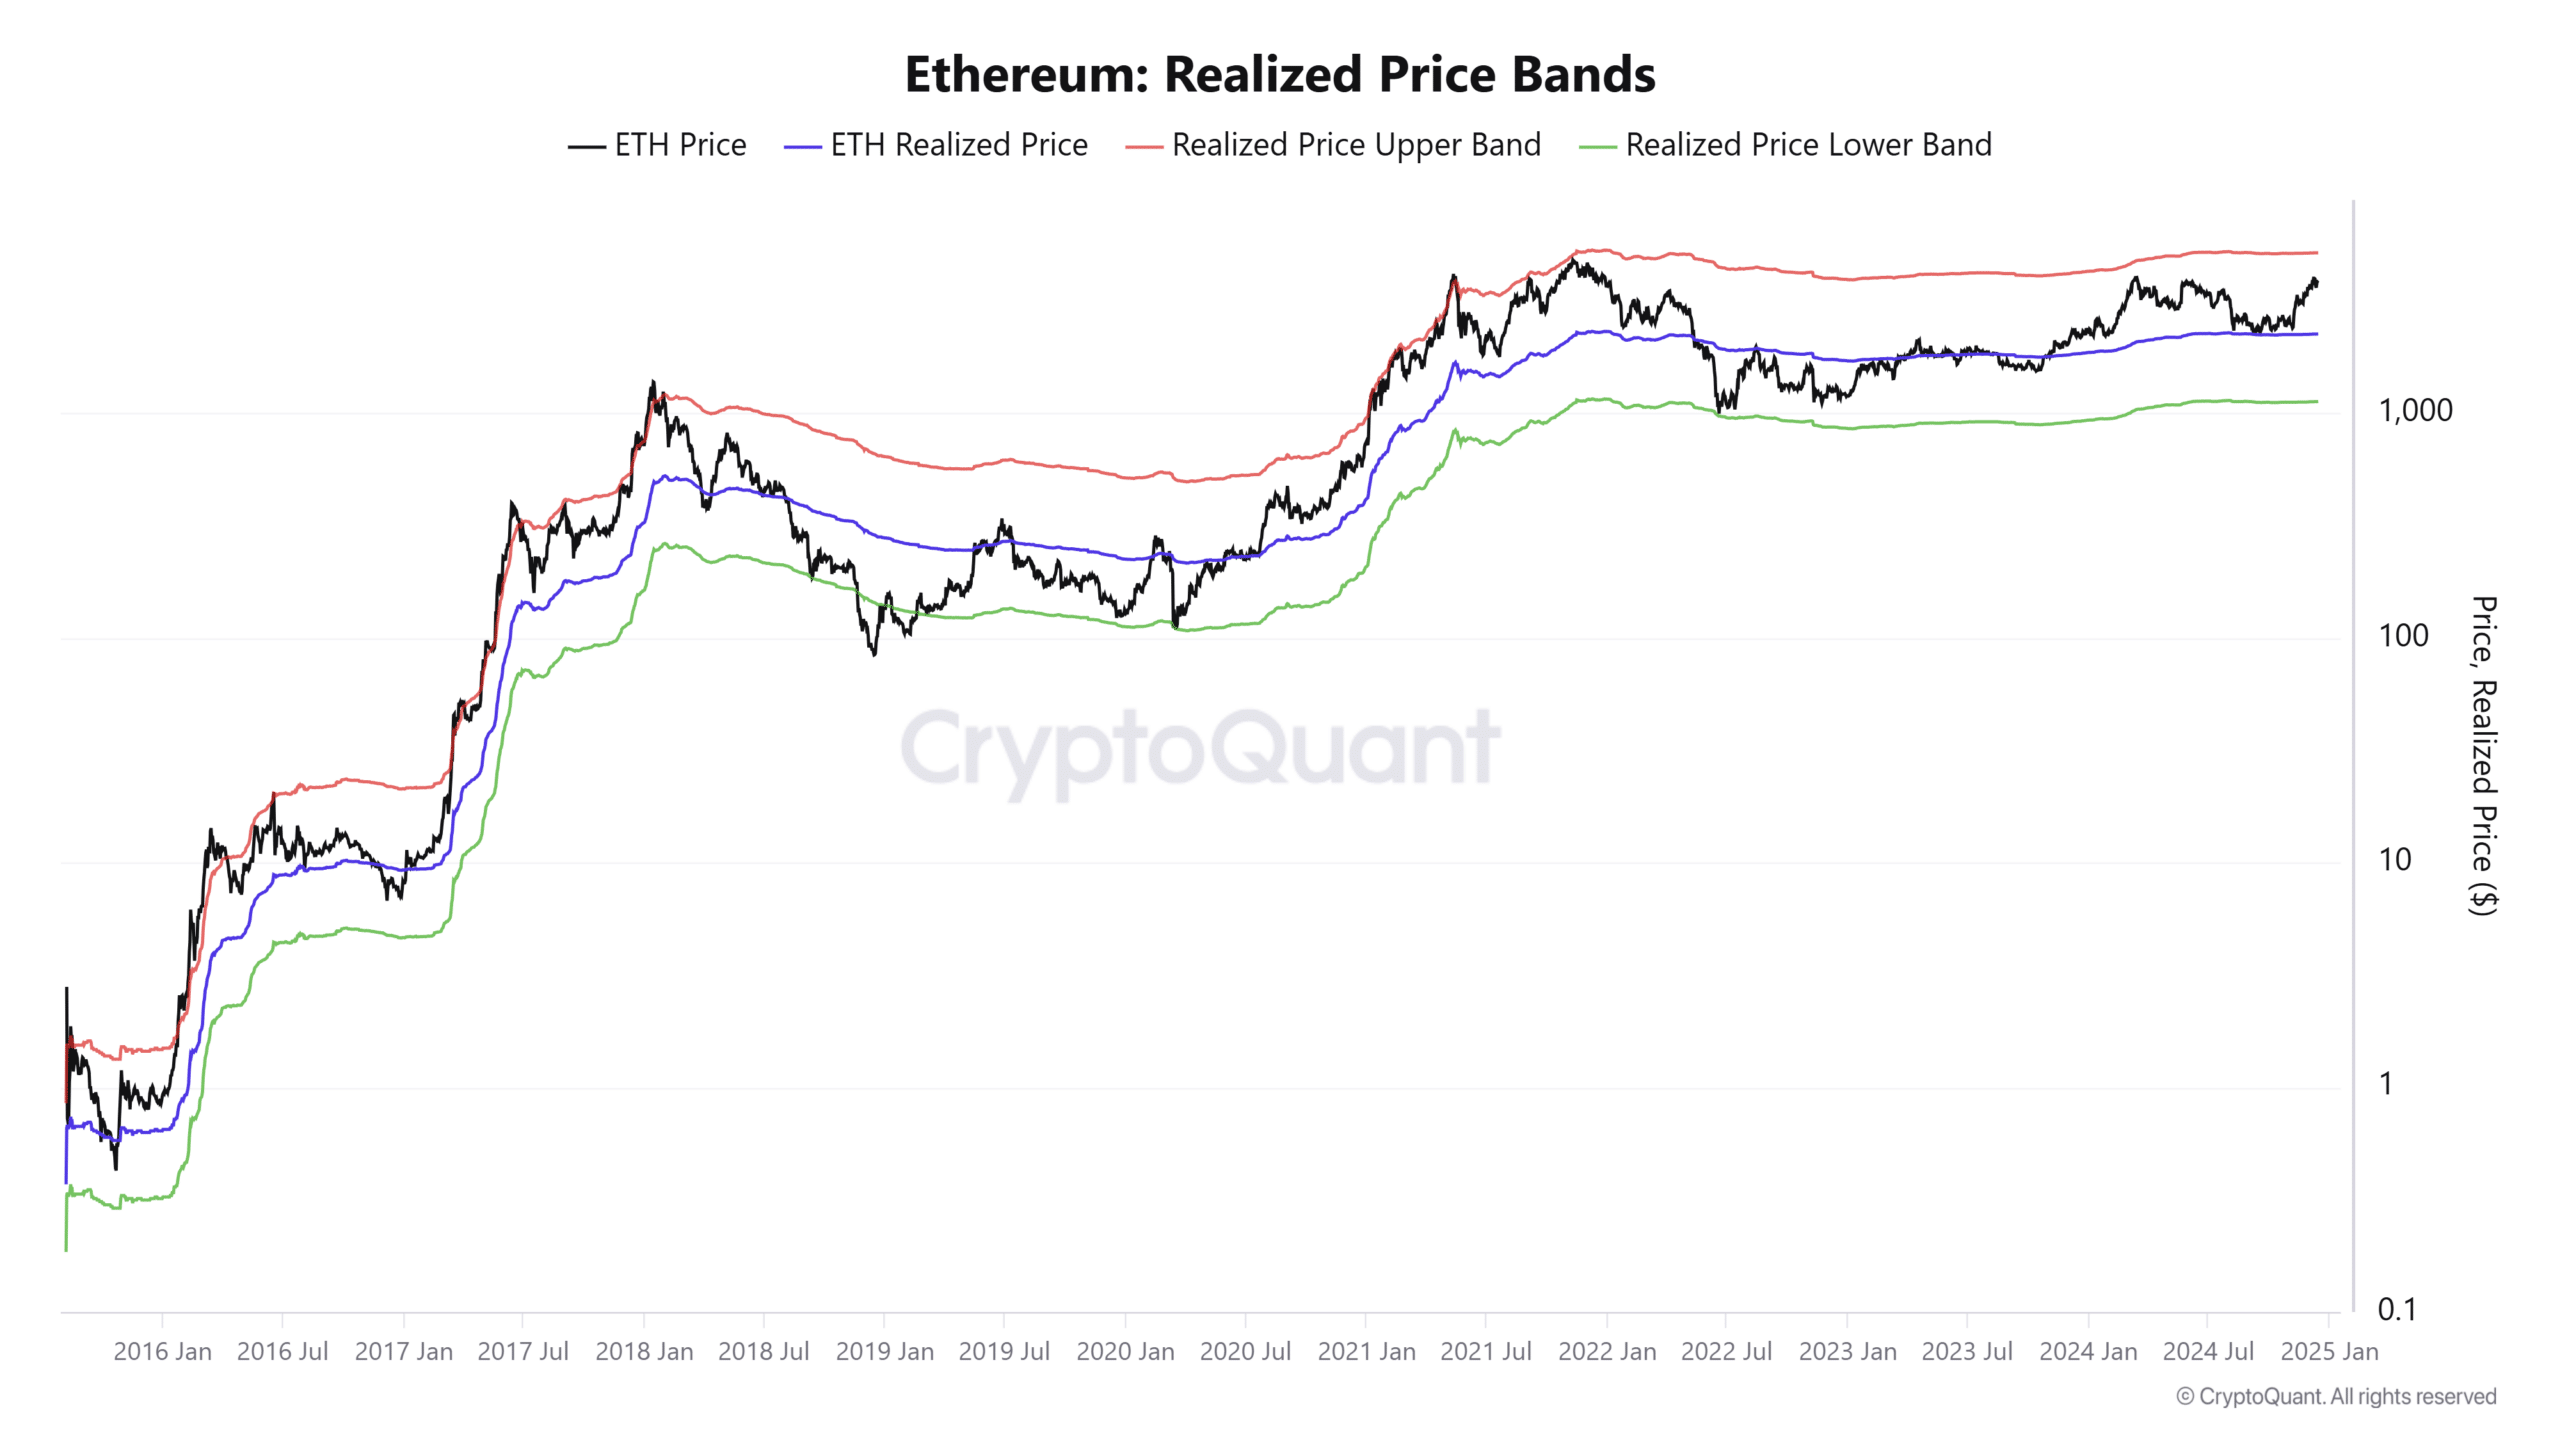
The upper realized price band, currently at $5,200, aligns with the peak of Ethereum’s 2021 bull run. This level serves as a psychological barrier and potential price target in the ongoing bull cycle.
Source: CryptoQuant
Additionally, Ethereum’s realized price of $2,300 reflects the average acquisition cost across the entire network, highlighting the profitability of current holders.
As the spot price hovers around $3,900, the gap between the realized price and the upper band hints at room for further upward movement.
Ethereum Fibonacci Extension Levels Signal…
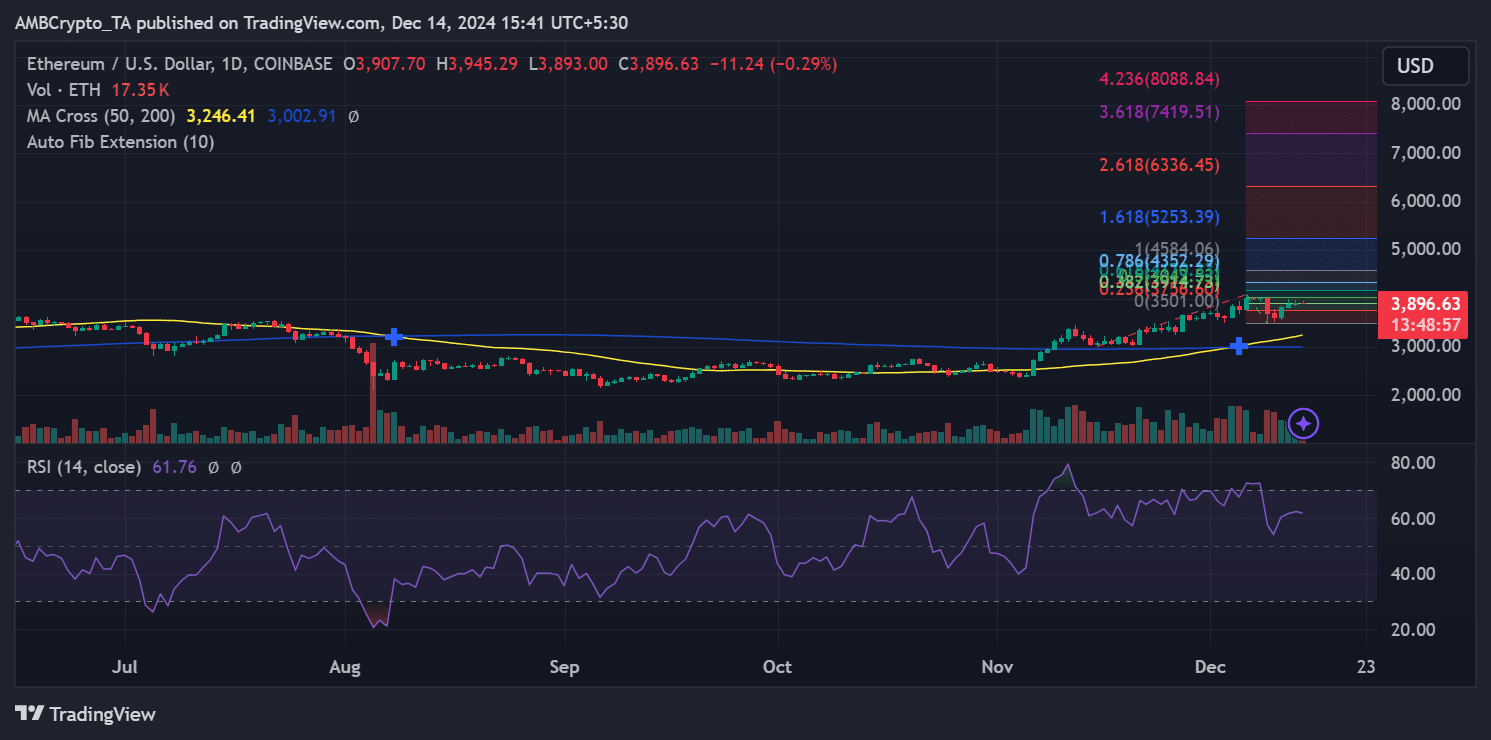
At press time, Ethereum was trading at $3,896. Key technical levels provide insight into its potential path forward. Analysis using the Fibonacci extension tool highlights critical resistance and target levels.
Ethereum was nearing the 1.618 Fibonacci extension level at $5,253, which closely matches the upper band of its realized price of $5,200.
Breaking above this level would indicate strong upside momentum, potentially setting the stage for a rally towards the $2.618 extension to $6,336 and beyond.
Source: TradingView
Ethereum’s intermediate resistance lies at $4,278, a significant hurdle identified by the 0.786 Fibonacci retracement level.
Conquering this level could pave the way for further upward momentum, bringing ETH closer to the psychological $5,000 mark. On the other hand, immediate support is near $3,700, which is the critical accumulation zone.
Supply dynamics and implications for $5,000
Favorable supply-demand dynamics are driving Ethereum price action. The concentration of holdings in the $3,700-$3,810 range and rapid expansion of active addresses demonstrate continued interest from long-term investors and new entrants.
If Ethereum maintains its current trajectory and breaks through key resistance levels, the $5,000 mark could become a reality sooner than expected.
Read Ethereum (ETH) Price Prediction 2024-25
Ethereum’s journey toward $5,000 is supported by strong accumulation zones, record network growth, and key Fibonacci extension levels that align with historical price metrics.
These converging factors highlight a well-supported bullish case for ETH, with the potential to surpass $5,000 as demand and technical momentum build.


