- Polkadot’s breakout and technical indicators point to a potential rebound towards $24.
- Growing development activity and social dominance have highlighted the growing market interest in the altcoin.
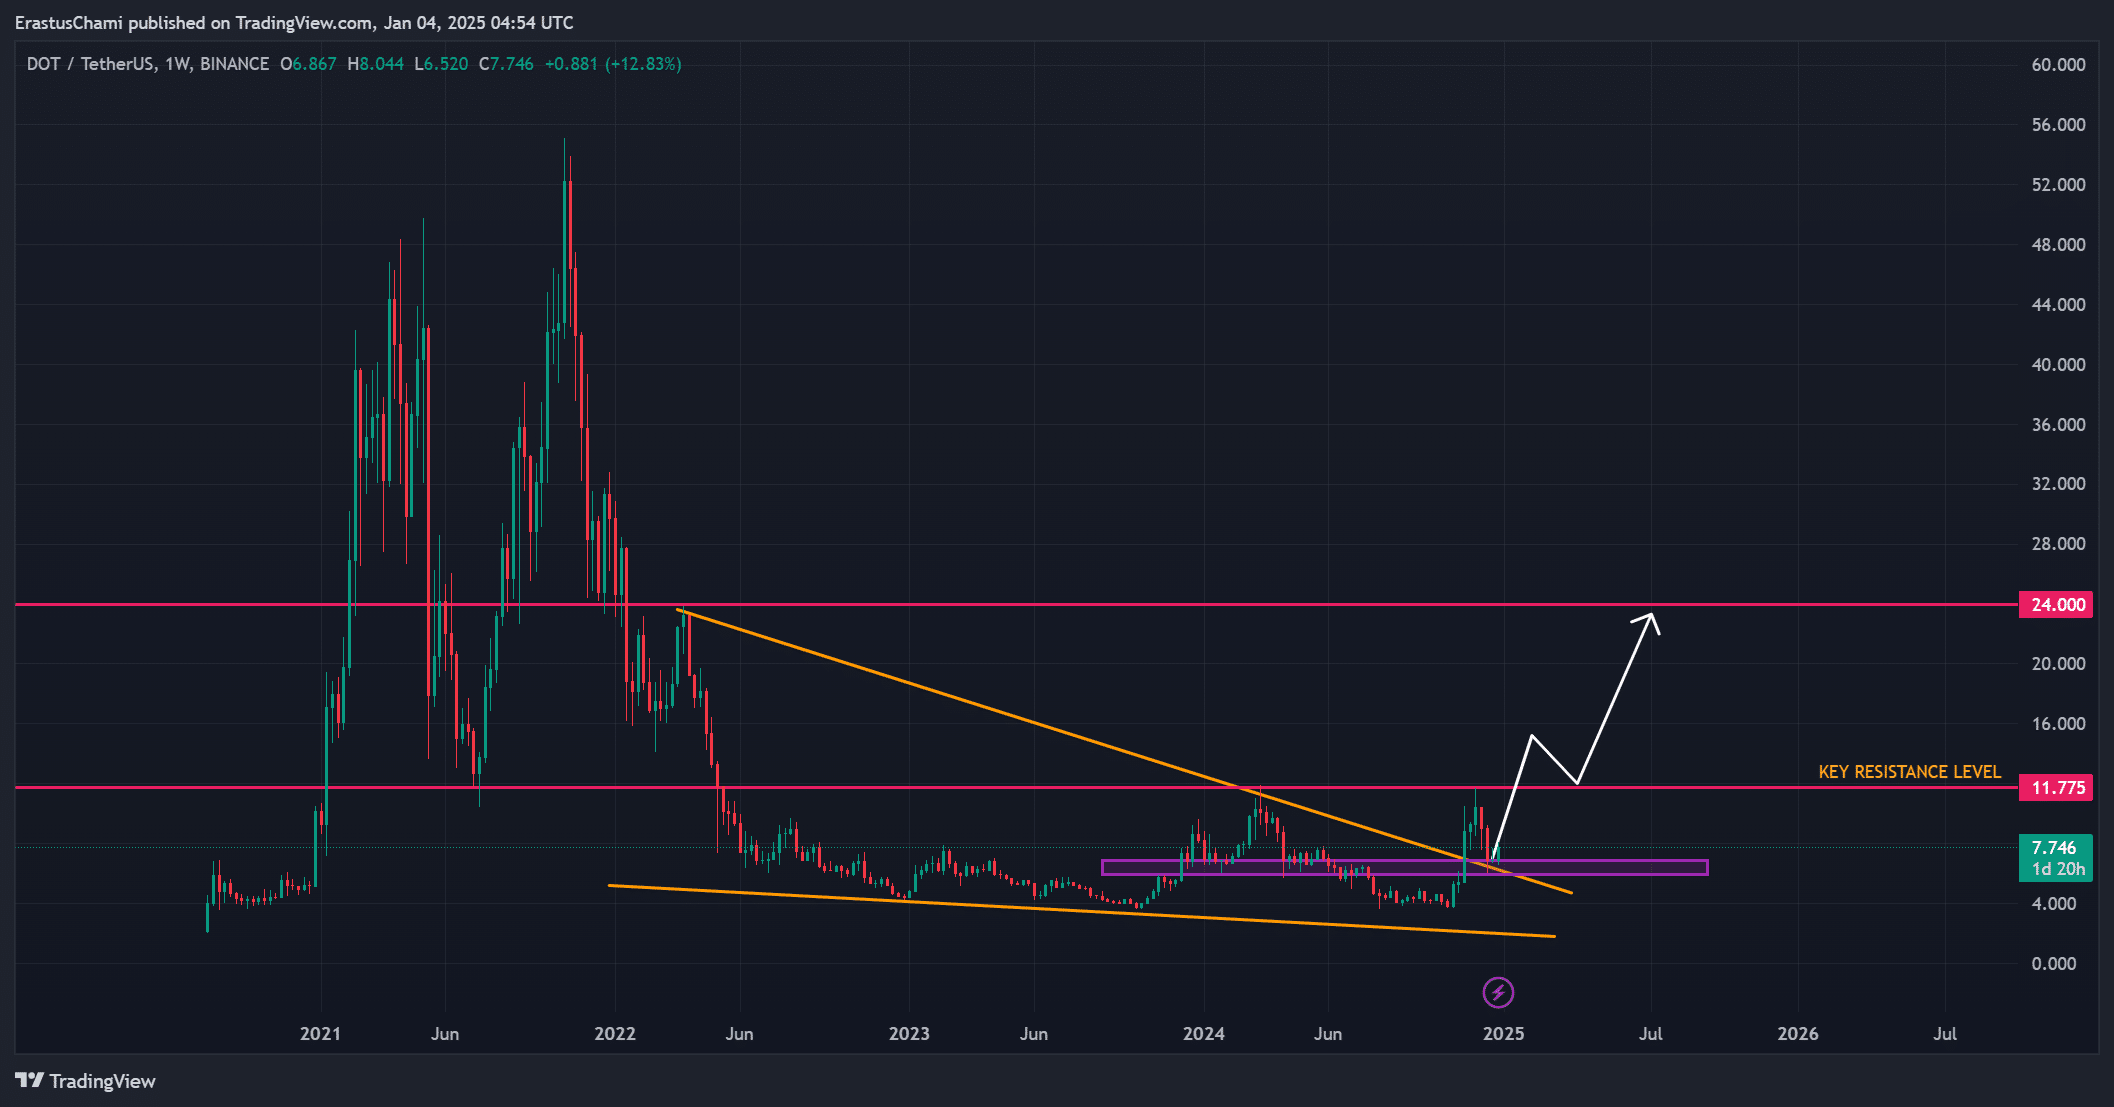
Polka dot (DOT) has caught the market’s attention with its recent price movement, following a notable breakout from a descending channel pattern. With a price of $7.72 after gains of 6.54% at press time, the altcoin appeared to demonstrate promising momentum on the charts.
Needless to say, the ongoing activity and metrics surrounding Polkadot have sparked curiosity about its potential direction in early 2025.
DOT breaks key resistance with strong setup
The breakout of Polkadot’s descending channel has paved the way for a potential rally, with the token reclaiming its bullish structure and forming a higher high.
Immediate resistance at $11.77 remains a key level to watch, while a successful breakout could open the way towards the $24 mark. These levels hinted at a potential upside of over 100% from the press time price, highlighting DOT’s promising trajectory.
Additionally, the consolidation following the breakout was strong, giving traders confidence in its long-term strength. Simply put, Polkadot’s technical outlook continues to align with market expectations for sustained growth.


Source: TradingView
Indicators suggest room for further growth
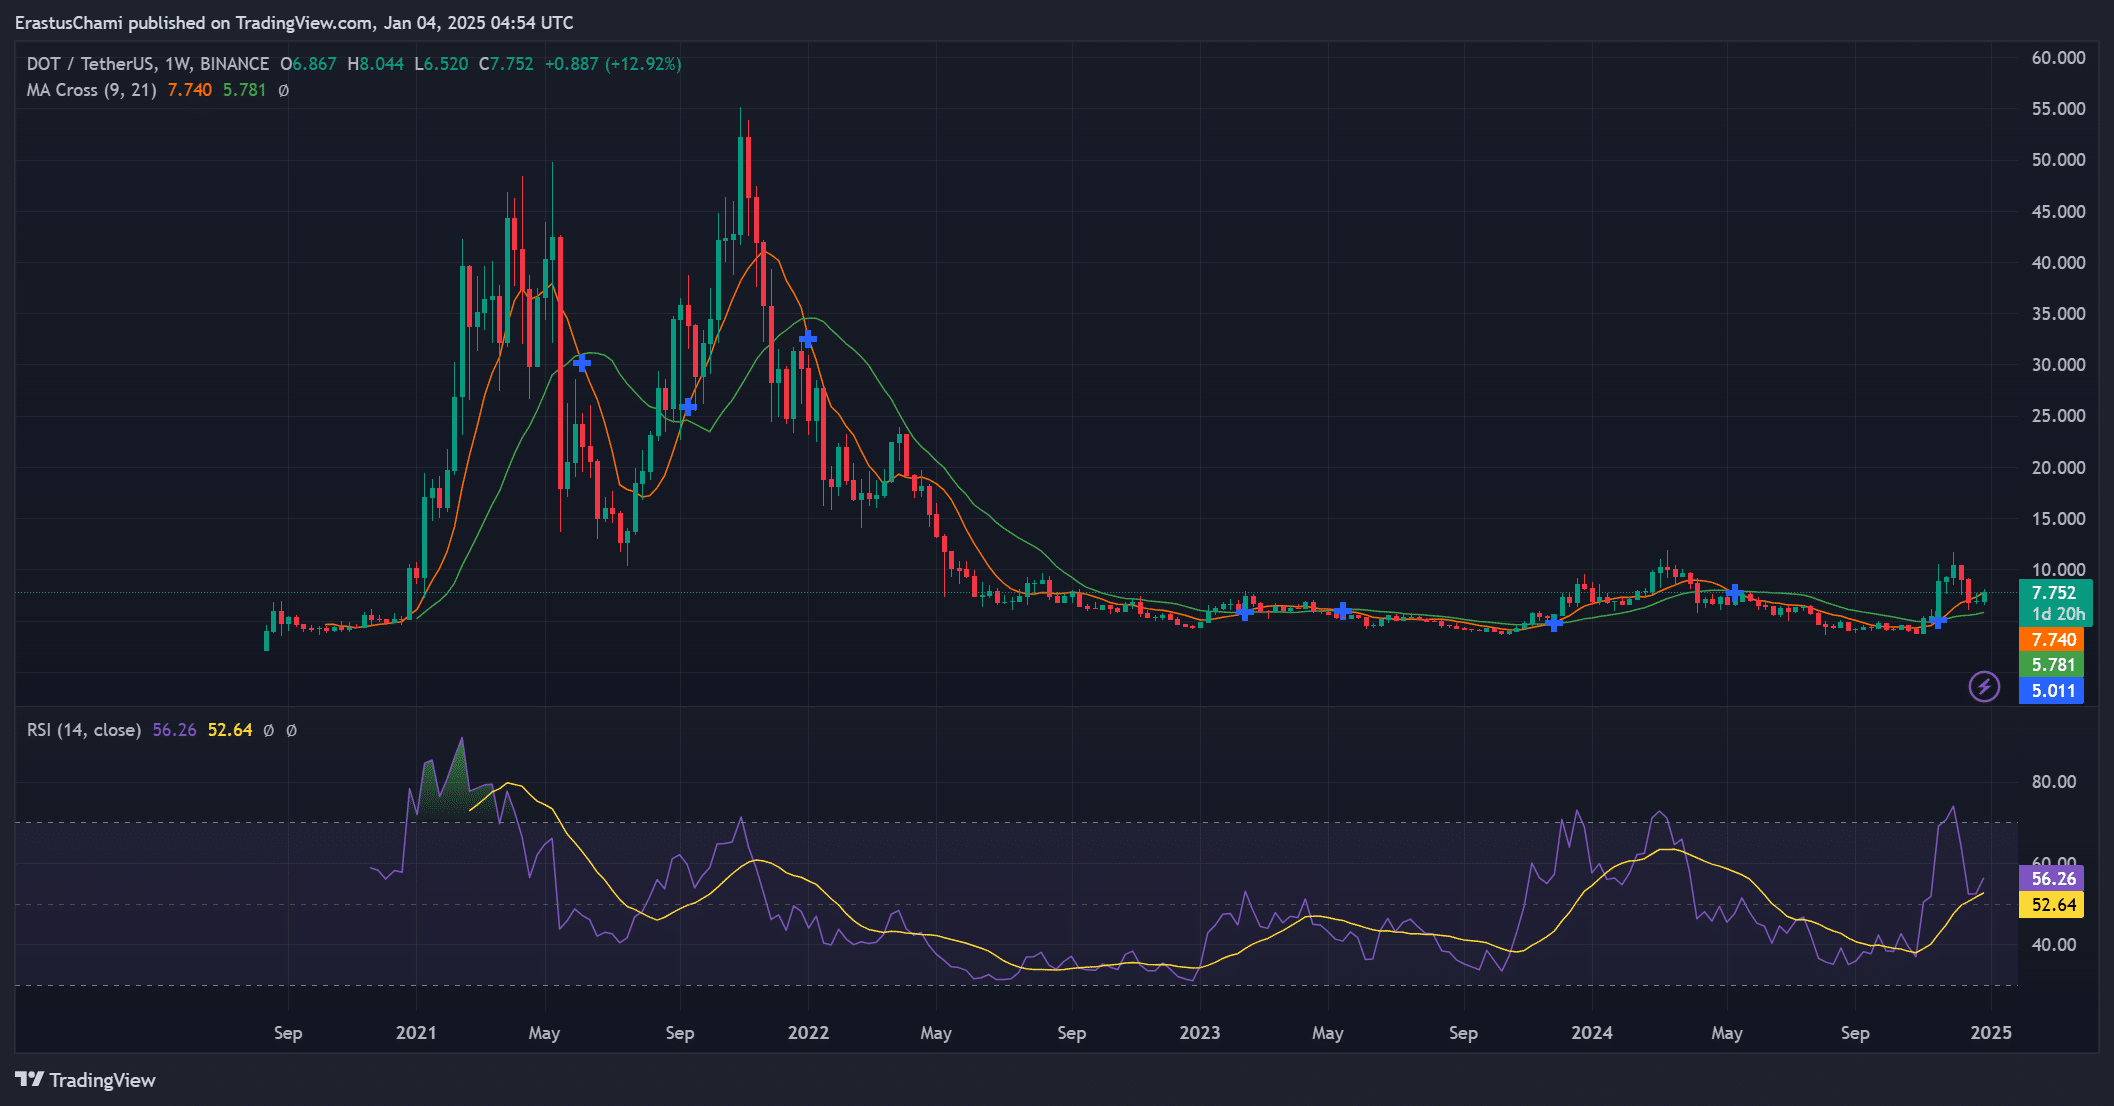
At press time, Polkadot’s technical indicators supported its bullish momentum, with several metrics highlighting the potential for further gains. The weekly MA crossover between the 9-day ($7.74) and 21-day moving averages ($5.78) also highlighted a confirmed uptrend.
Additionally, the RSI at 56.26 indicates that there could still be room for price appreciation, before entering overbought territory. Furthermore, the clear alignment of these indicators with the altcoin’s price action reinforced the idea that Polkadot could be positioned for a sustained upward move.


Source: TradingView
Social dominance increases with market interest
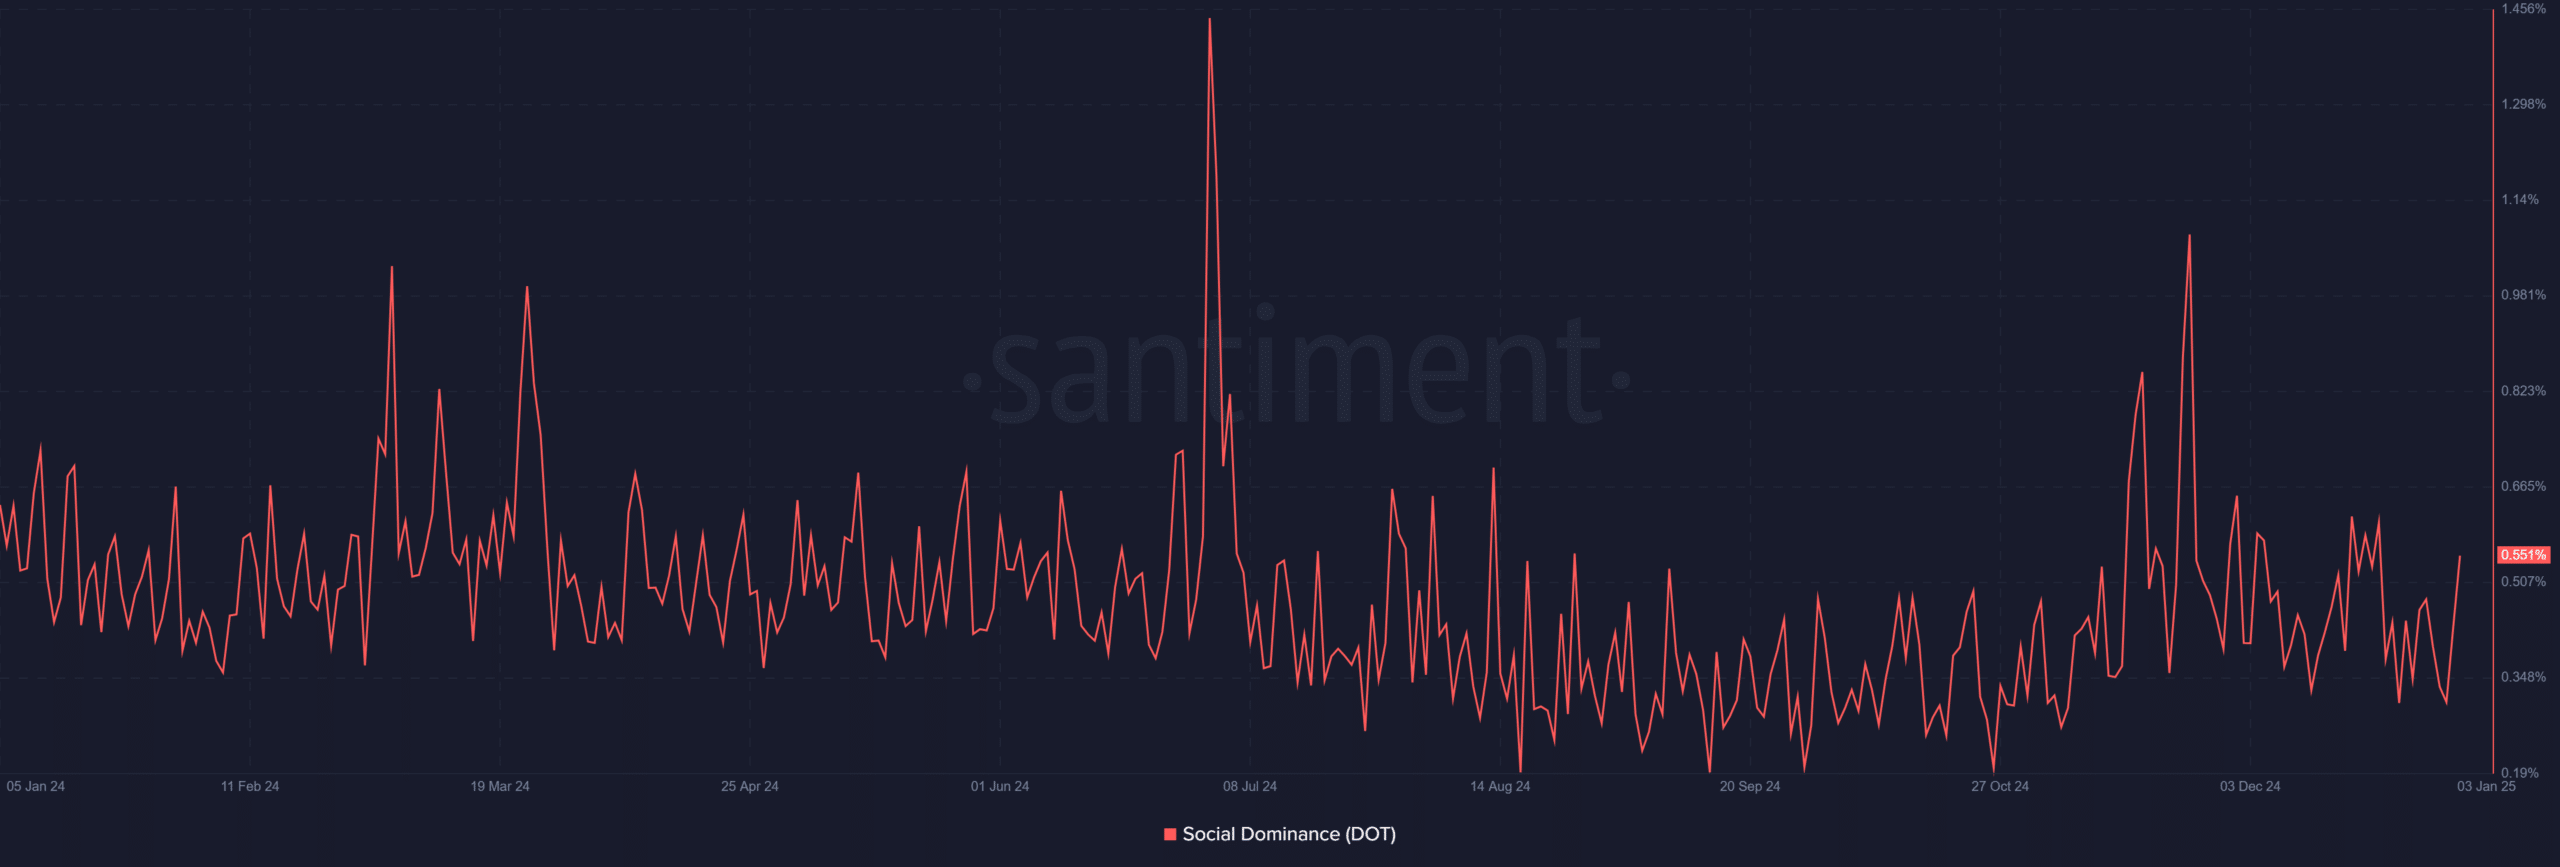
Polkadot’s social dominance increased from 0.432% to 0.551% – a sign of greater attention from the community and investors. Such an increase in market interest often correlates with better price performance, as more participants engage in the ecosystem.
Furthermore, the increase in social activity can be interpreted as a sign of growing confidence in Polkadot’s potential, adding another layer of support to its bullish narrative.


Source: Santiment
Liquidations Reflect Bullish Sentiment
Polkadot’s total liquidations also highlighted the active trading environment around the token. At $7.76, $37,160 of short positions were liquidated, compared to $26,610 of long positions – a sign that bullish traders have gained the upper hand.
This disparity underscored confidence in Polkadot’s price trajectory and a favorable market environment for further gains.


Source: Coinglass
DOT development activity signals network strength
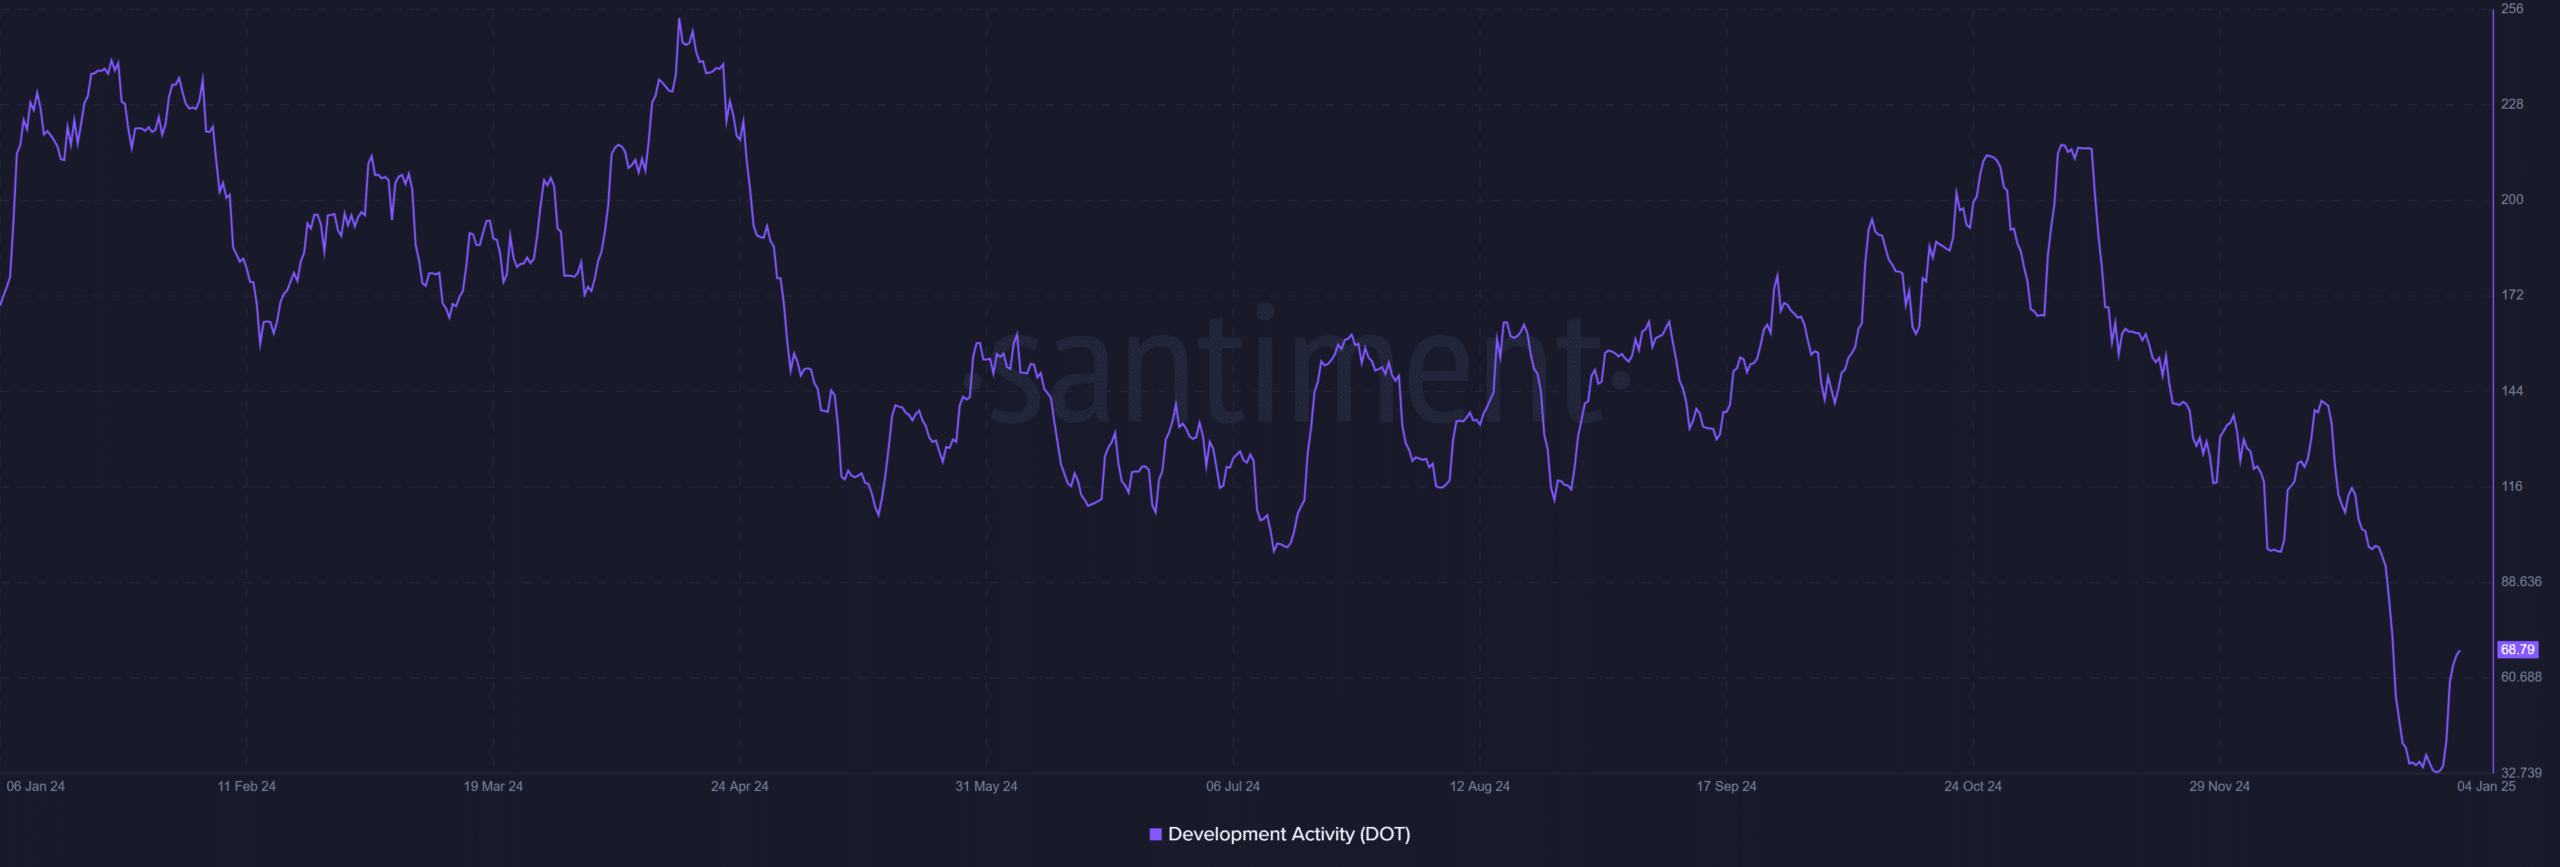
Finally, Polkadot development activity rebounded to 68.79 after hitting a recent low, demonstrating its ecosystem’s commitment to growth. This steady rise has highlighted its continued innovation and expansion – crucial for long-term sustainability.
Here, it is worth noting that an increase in development activities reassures investors about the resilience of blockchain and its potential for further adoption.


Source: Santiment
Read Polkadot (DOT) Price Prediction 2024-2025
The breakout of Polkadot’s descending channel, bullish indicators and increasing development activity point to strong momentum through 2025.
Therefore, it is highly likely that DOT will maintain this upward trajectory and generate significant gains. However, potential market volatility could temporarily hamper this climb.


