


Polkadot (DOT) has returned to the center of crypto discussions, but not for the reasons the bulls would have preferred.
Growing concerns about adoption, competition and long-term growth prospects have dominated conversations, pushing sentiment toward levels of fear rarely seen in recent months.
Traders increasingly wondered whether Polkadot could convert its strong development activity into stronger user growth and better price performance.
The change in sentiment has become evident over the past month.
May 18, DOT recorded a bullish comment ratio of 6.39. However, by June 18, this figure had fallen to just 1.18, marking a sharp deterioration in confidence.
The figure also remained well below the crowd greed threshold of 3.0, placing sentiment firmly in fear territory. Despite the negativity, discussion volume has remained high, making DOT one of the most controversial assets in crypto.
DOT exits have persisted despite growing attention
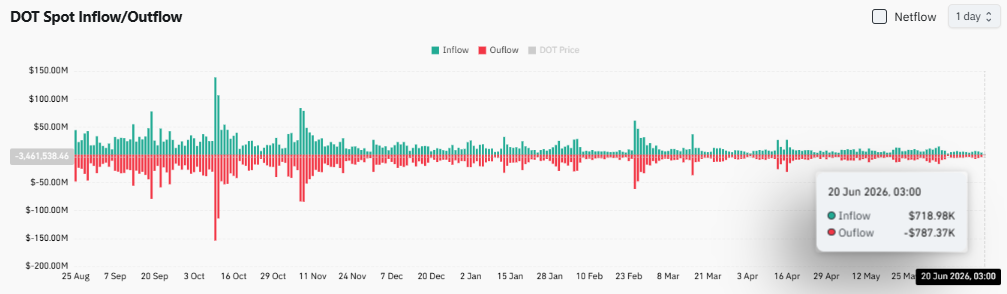
Trading flow data showed that capital continued to leave exchanges despite increased social activity around DOT.
At the time of writing, spot inflows reached approximately $718,980, while outflows totaled approximately $787,370. This left a negative net flow of approximately $68,390.
The imbalance suggests that holders continue to withdraw slightly more tokens than they deposit on trading platforms.
Although persistent capital outflows may reflect reduced selling intentions, the margin between inflows and outflows has remained relatively small.
As a result, exchange activity did not result in aggressive accumulation or mass distribution.
Instead, investors appeared cautious as they monitored whether Polkadot’s growing visibility could translate into stronger market demand.
DOT defends its support but resistance remains intact
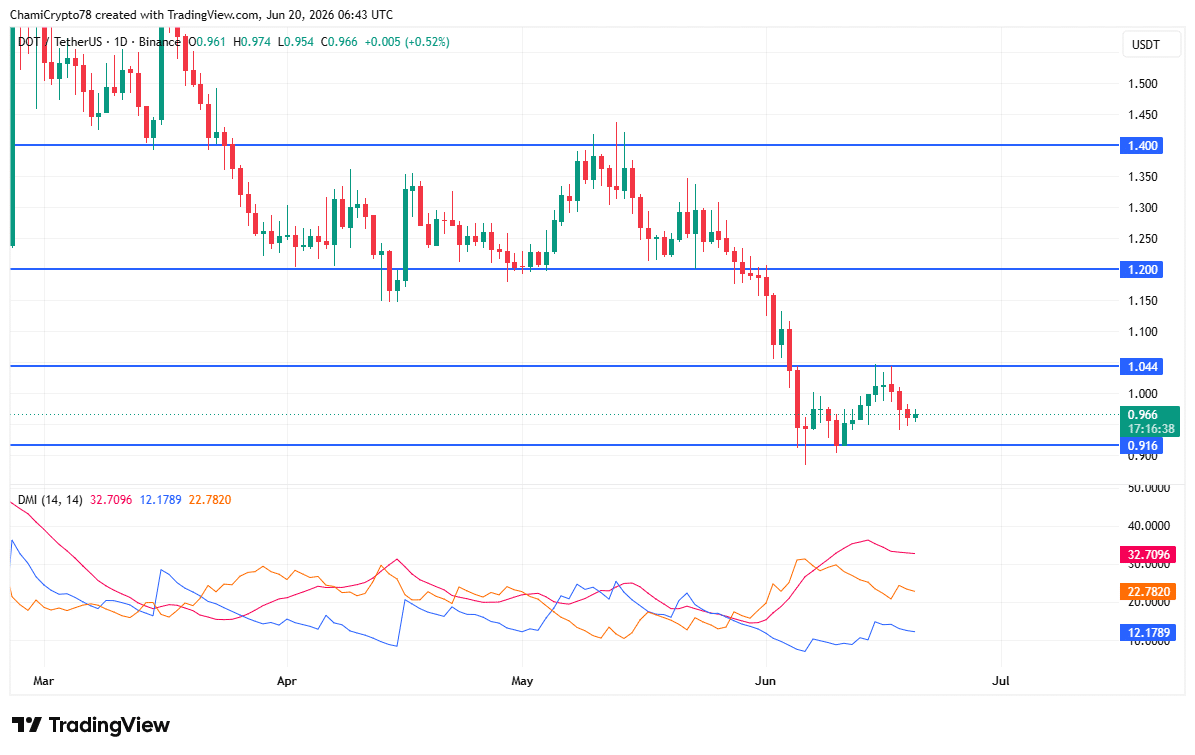
At the time of going to press, POINT was trading near $0.966 after settling above the $0.916 support level that halted its recent decline.
Buyers avoided a deeper breakdown and helped prices recover slightly from June lows. However, DOT remained below the key resistance area of $1.044, leaving the broader structure under pressure.
The DMI indicator showed that bearish control persisted despite signs of stabilization. The ADX stands at 32.70, confirming a strong dominant trend.
Meanwhile, the -DI measured 22.78, comfortably above the +DI of 12.18, indicating that sellers still held the advantage.
If buyers reclaim $1.044, sentiment could improve further. Still, a break below $0.916 would likely put further pressure on the market.
Liquidity Zones Highlight Upcoming Targets
Liquidation data revealed notable liquidity concentrations above and below the current price. The strongest bullish cluster was between $0.98 and $1.00, creating a potential sweet spot if buyers extended the rally.
Another pocket of significant liquidity appeared near $1.008, reinforcing the resistance overhead. Below market, substantial liquidity remained concentrated around $0.94 and $0.93.
These levels could attract prices if support weakens and sellers regain control. The heat map therefore presented a balanced configuration rather than a clearly directional one.
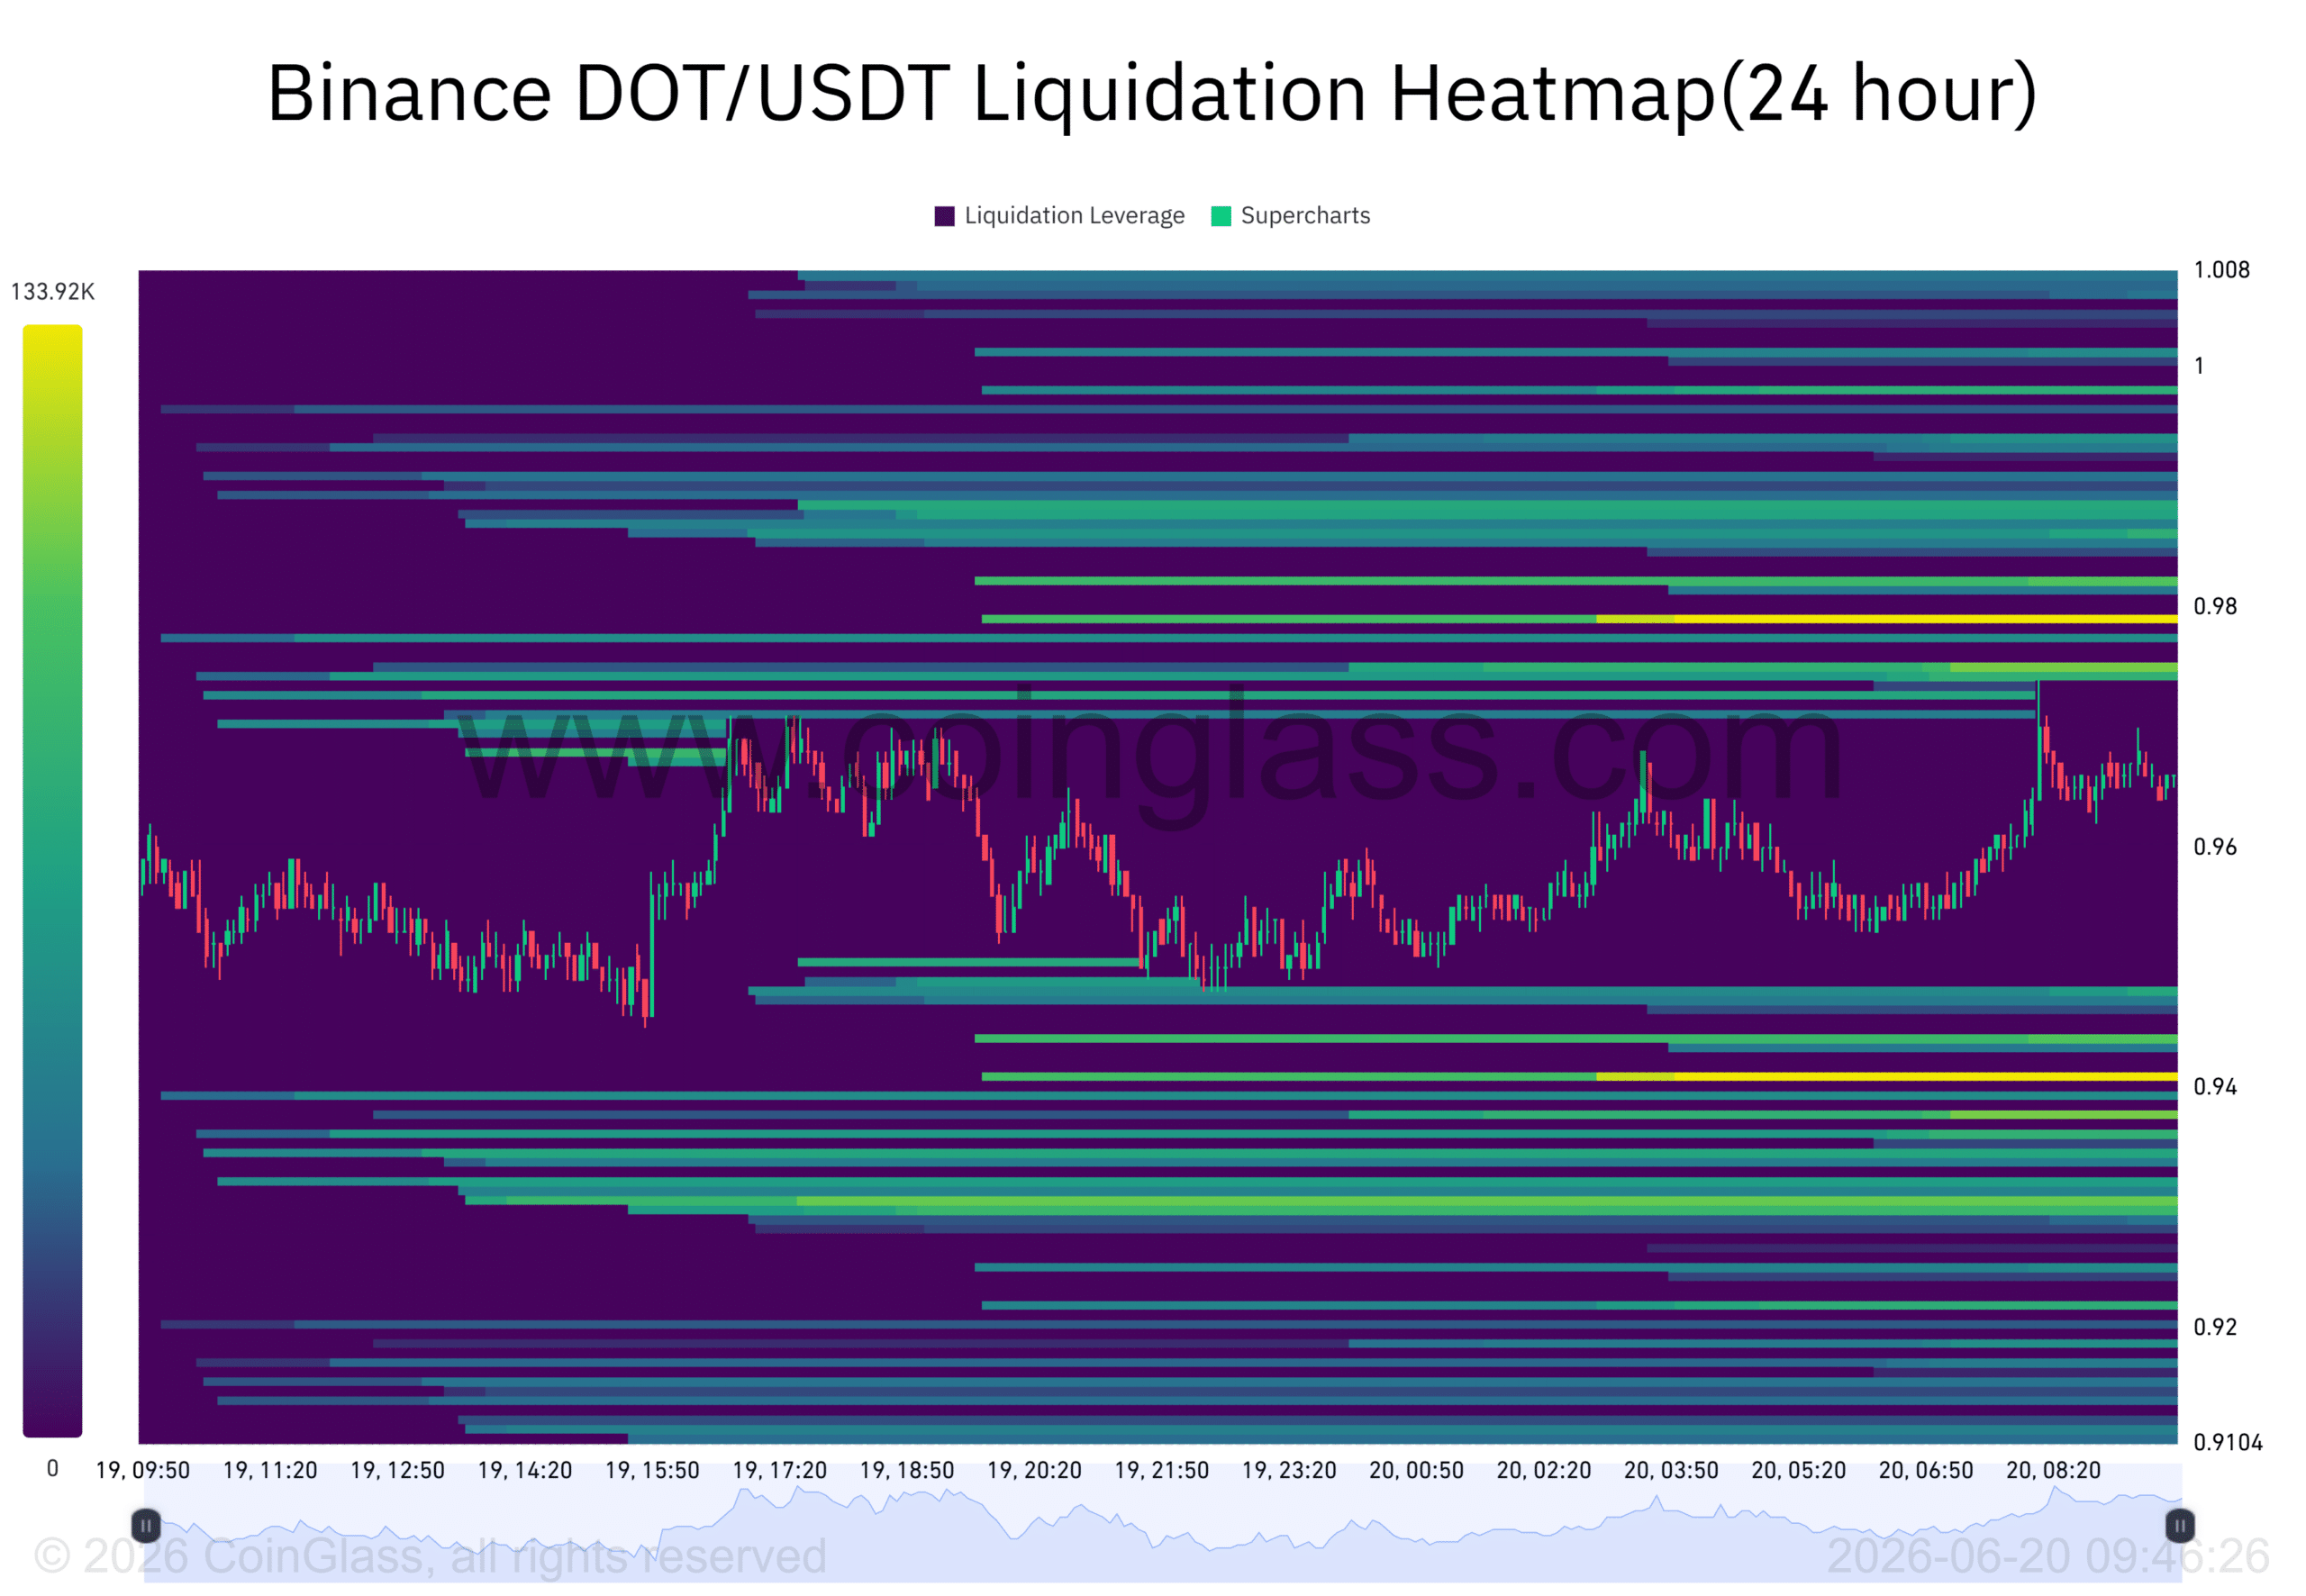
If DOT rises above $0.98, liquidity around $1.00 could be highlighted. If the downside pressure builds, clusters below the current price could become the next downside targets.
Final Summary
- Polkadot remained highly discussed even though investor confidence has weakened significantly.
- DOT held key support, but resistance continued to limit recovery attempts.