


Sky (SKY) has been moving higher in the market, with the asset surging 12% in the last 24 hours. In fact, its technical chart seems to indicate the possibility of sustained bullish momentum on the charts.
While on-chain activity charted a clear path at press time, chart patterns suggested the crypto could expand even further and extend its trajectory.
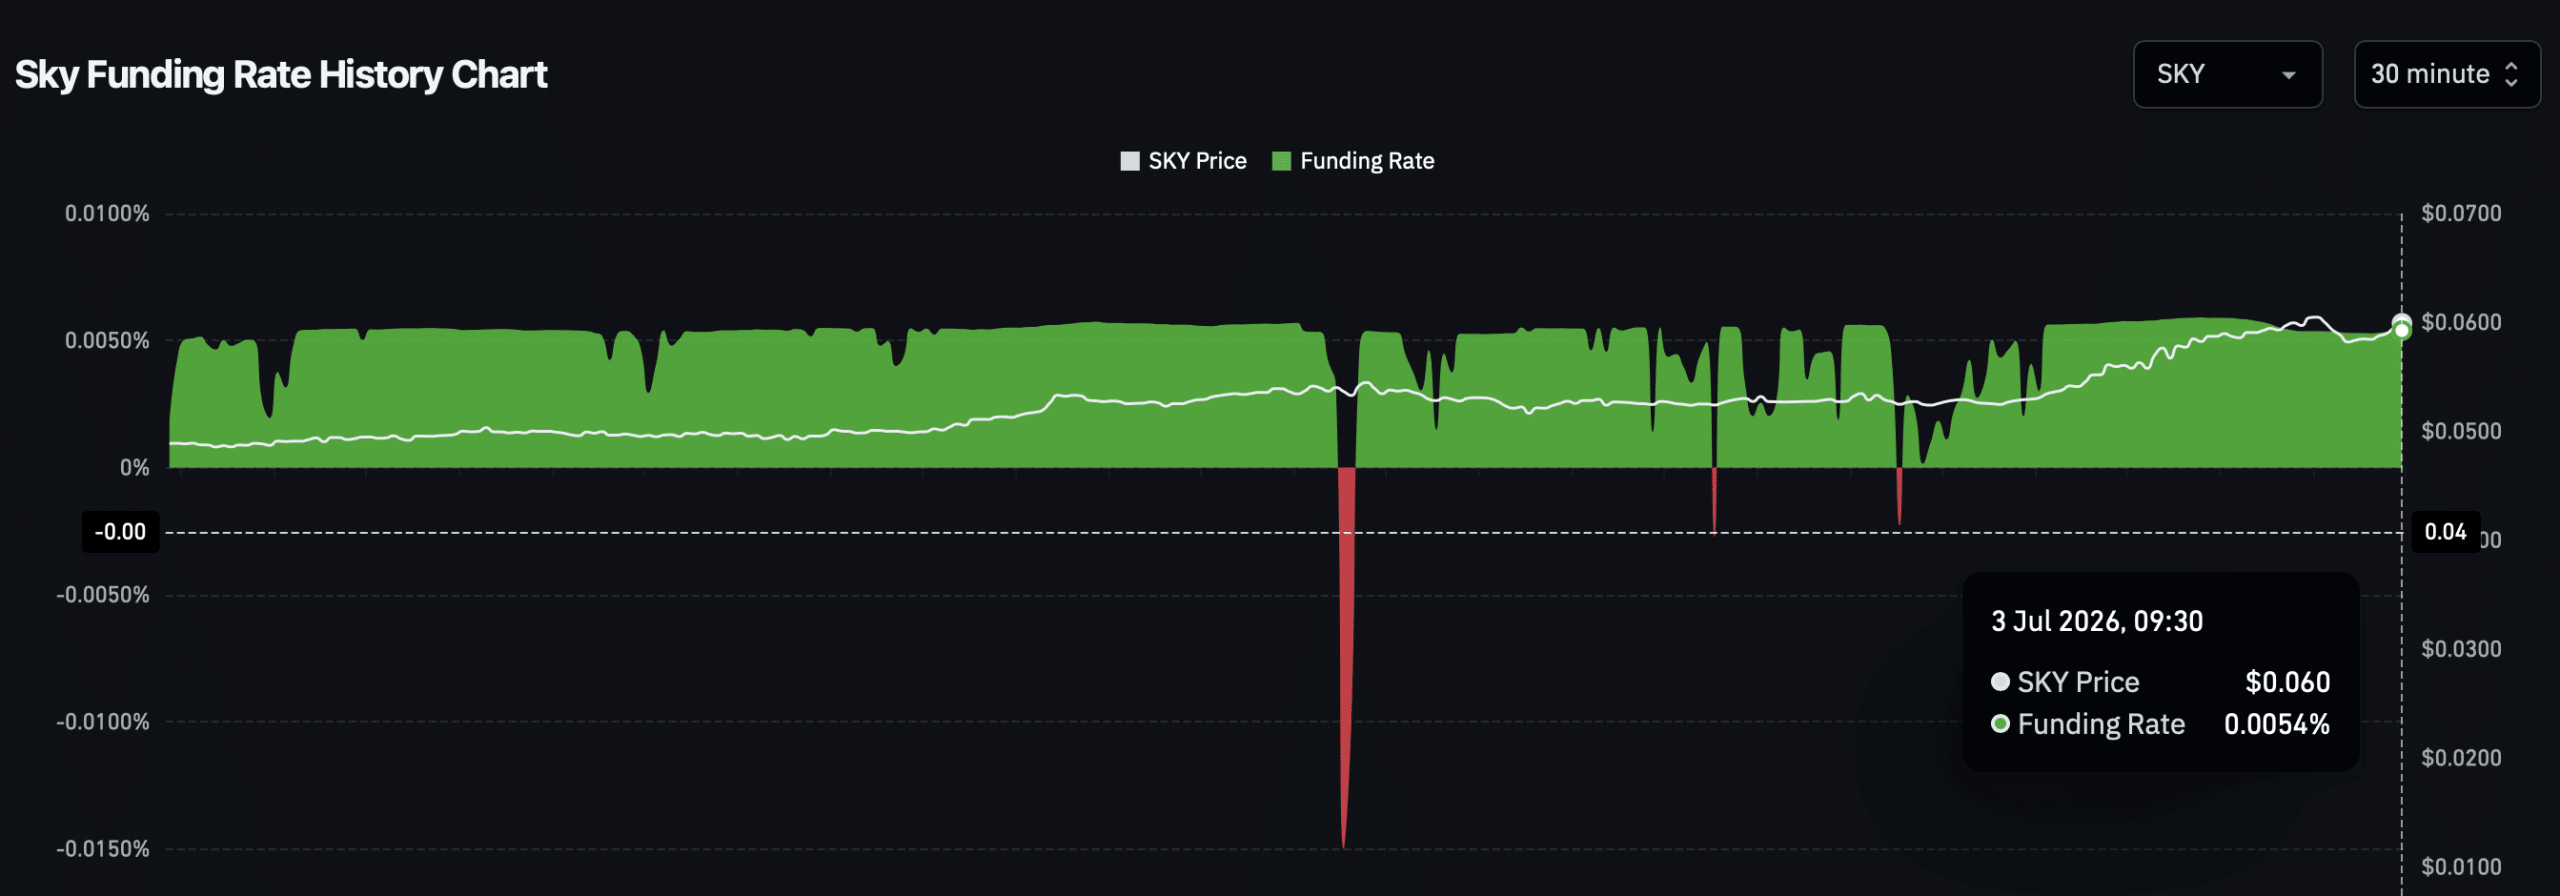
Is the financing rate overheating?
The clearest indicator that the recovery is continuing has been the funding rate data. Funding rates reveal which direction capital in the perpetual market is moving and whether long or short trades dominate the flow.
At the time of writing, the funding rate was positive while remaining at a moderately high level. This suggests that the bullish positioning has not become excessive, with the setup still favorable for the price.
What seemed to make the trend sustainable was the influx of new capital into the market, with open interest rates rising. In fact, open interest jumped 14.25% to $30.24 million at the time of writing.
These entries totaled $4.3 million over the past 24 hours. The influx of capital while the funding rate remains positive may be evidence that long traders are still expecting more upside and are positioning themselves accordingly, without slipping into an excessive uptrend.
At press time, the funding rate was just 0.0054% – a moderately bullish reading that could be enough to keep the outlook intact.
Volume increases with price
Volume continued to climb alongside price, a combination that hints at the positive momentum behind the altcoin.
At press time, volume was up 106% to $31 million. A closer look at the perpetual market also revealed the same sentiment prevailing in this segment.
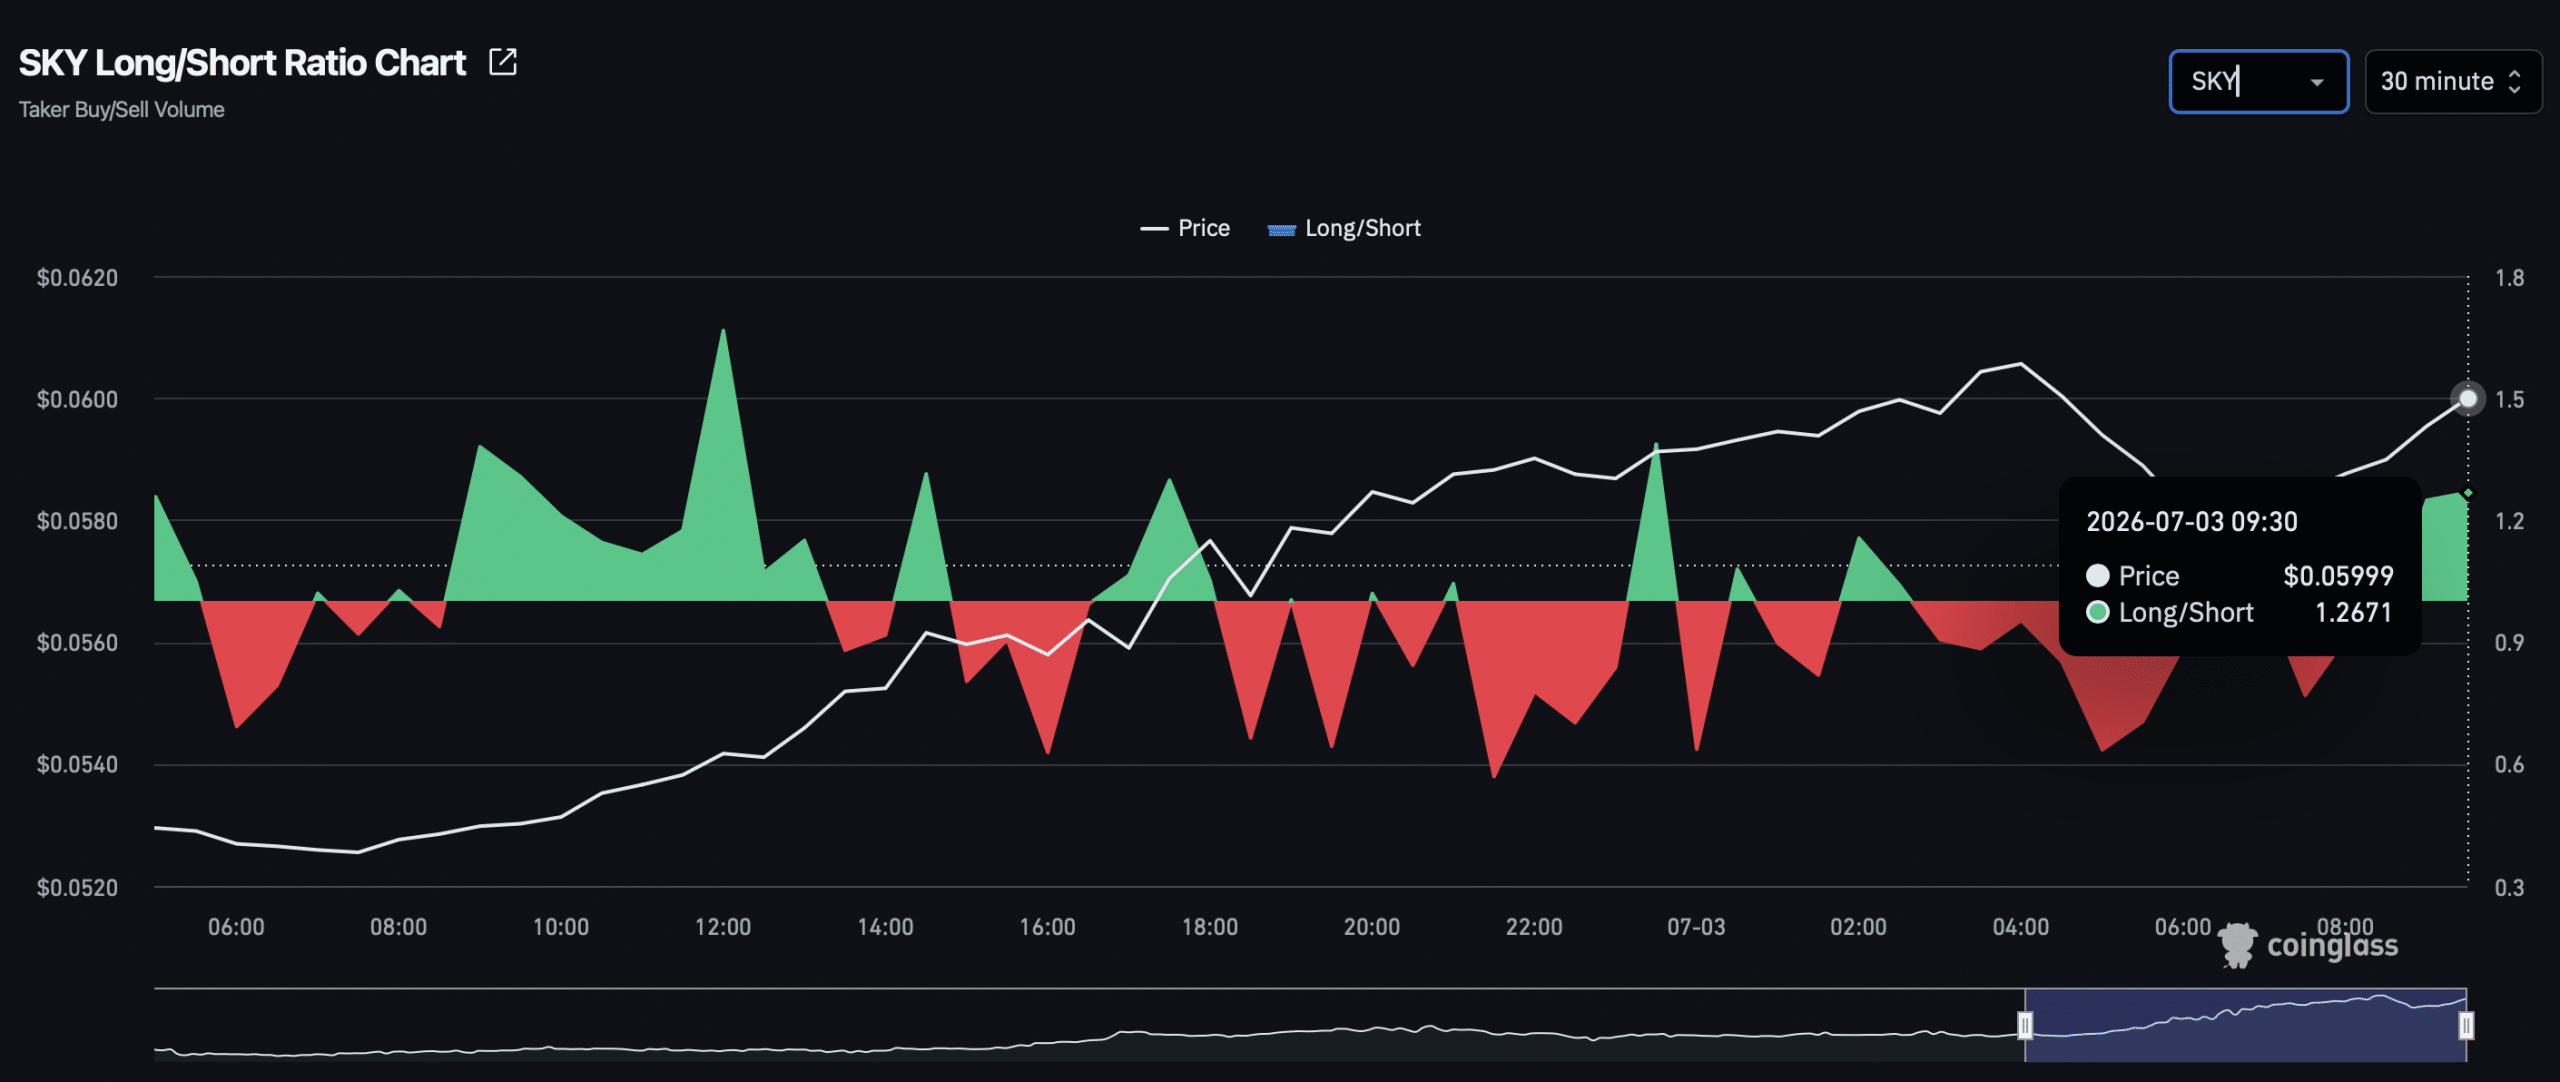
The perpetual market’s long-to-short ratio also climbed, reaching a new high of around 1.27. This suggests that most trading accounts were bullish.
The long/short ratio measures whether bulls or bears dominate a market. A reading above 1 generally indicates higher buying volume, while a reading below 1 indicates higher selling volume.
In the case of SKY, the ratio continued to increase, meaning more accounts moved in the same direction as the altcoin maintained its upward surge.
Is SKY Eyeing the Next Resistance Level?
SKY showed signs of optimism on the charts, with the altcoin breaking through a descending resistance trendline that it has been following for weeks.
After this breakout, the price broke through another key horizontal resistance level and moved higher. For a confirmed bullish outlook, the price must close comfortably above this level and continue to form ascending candles.
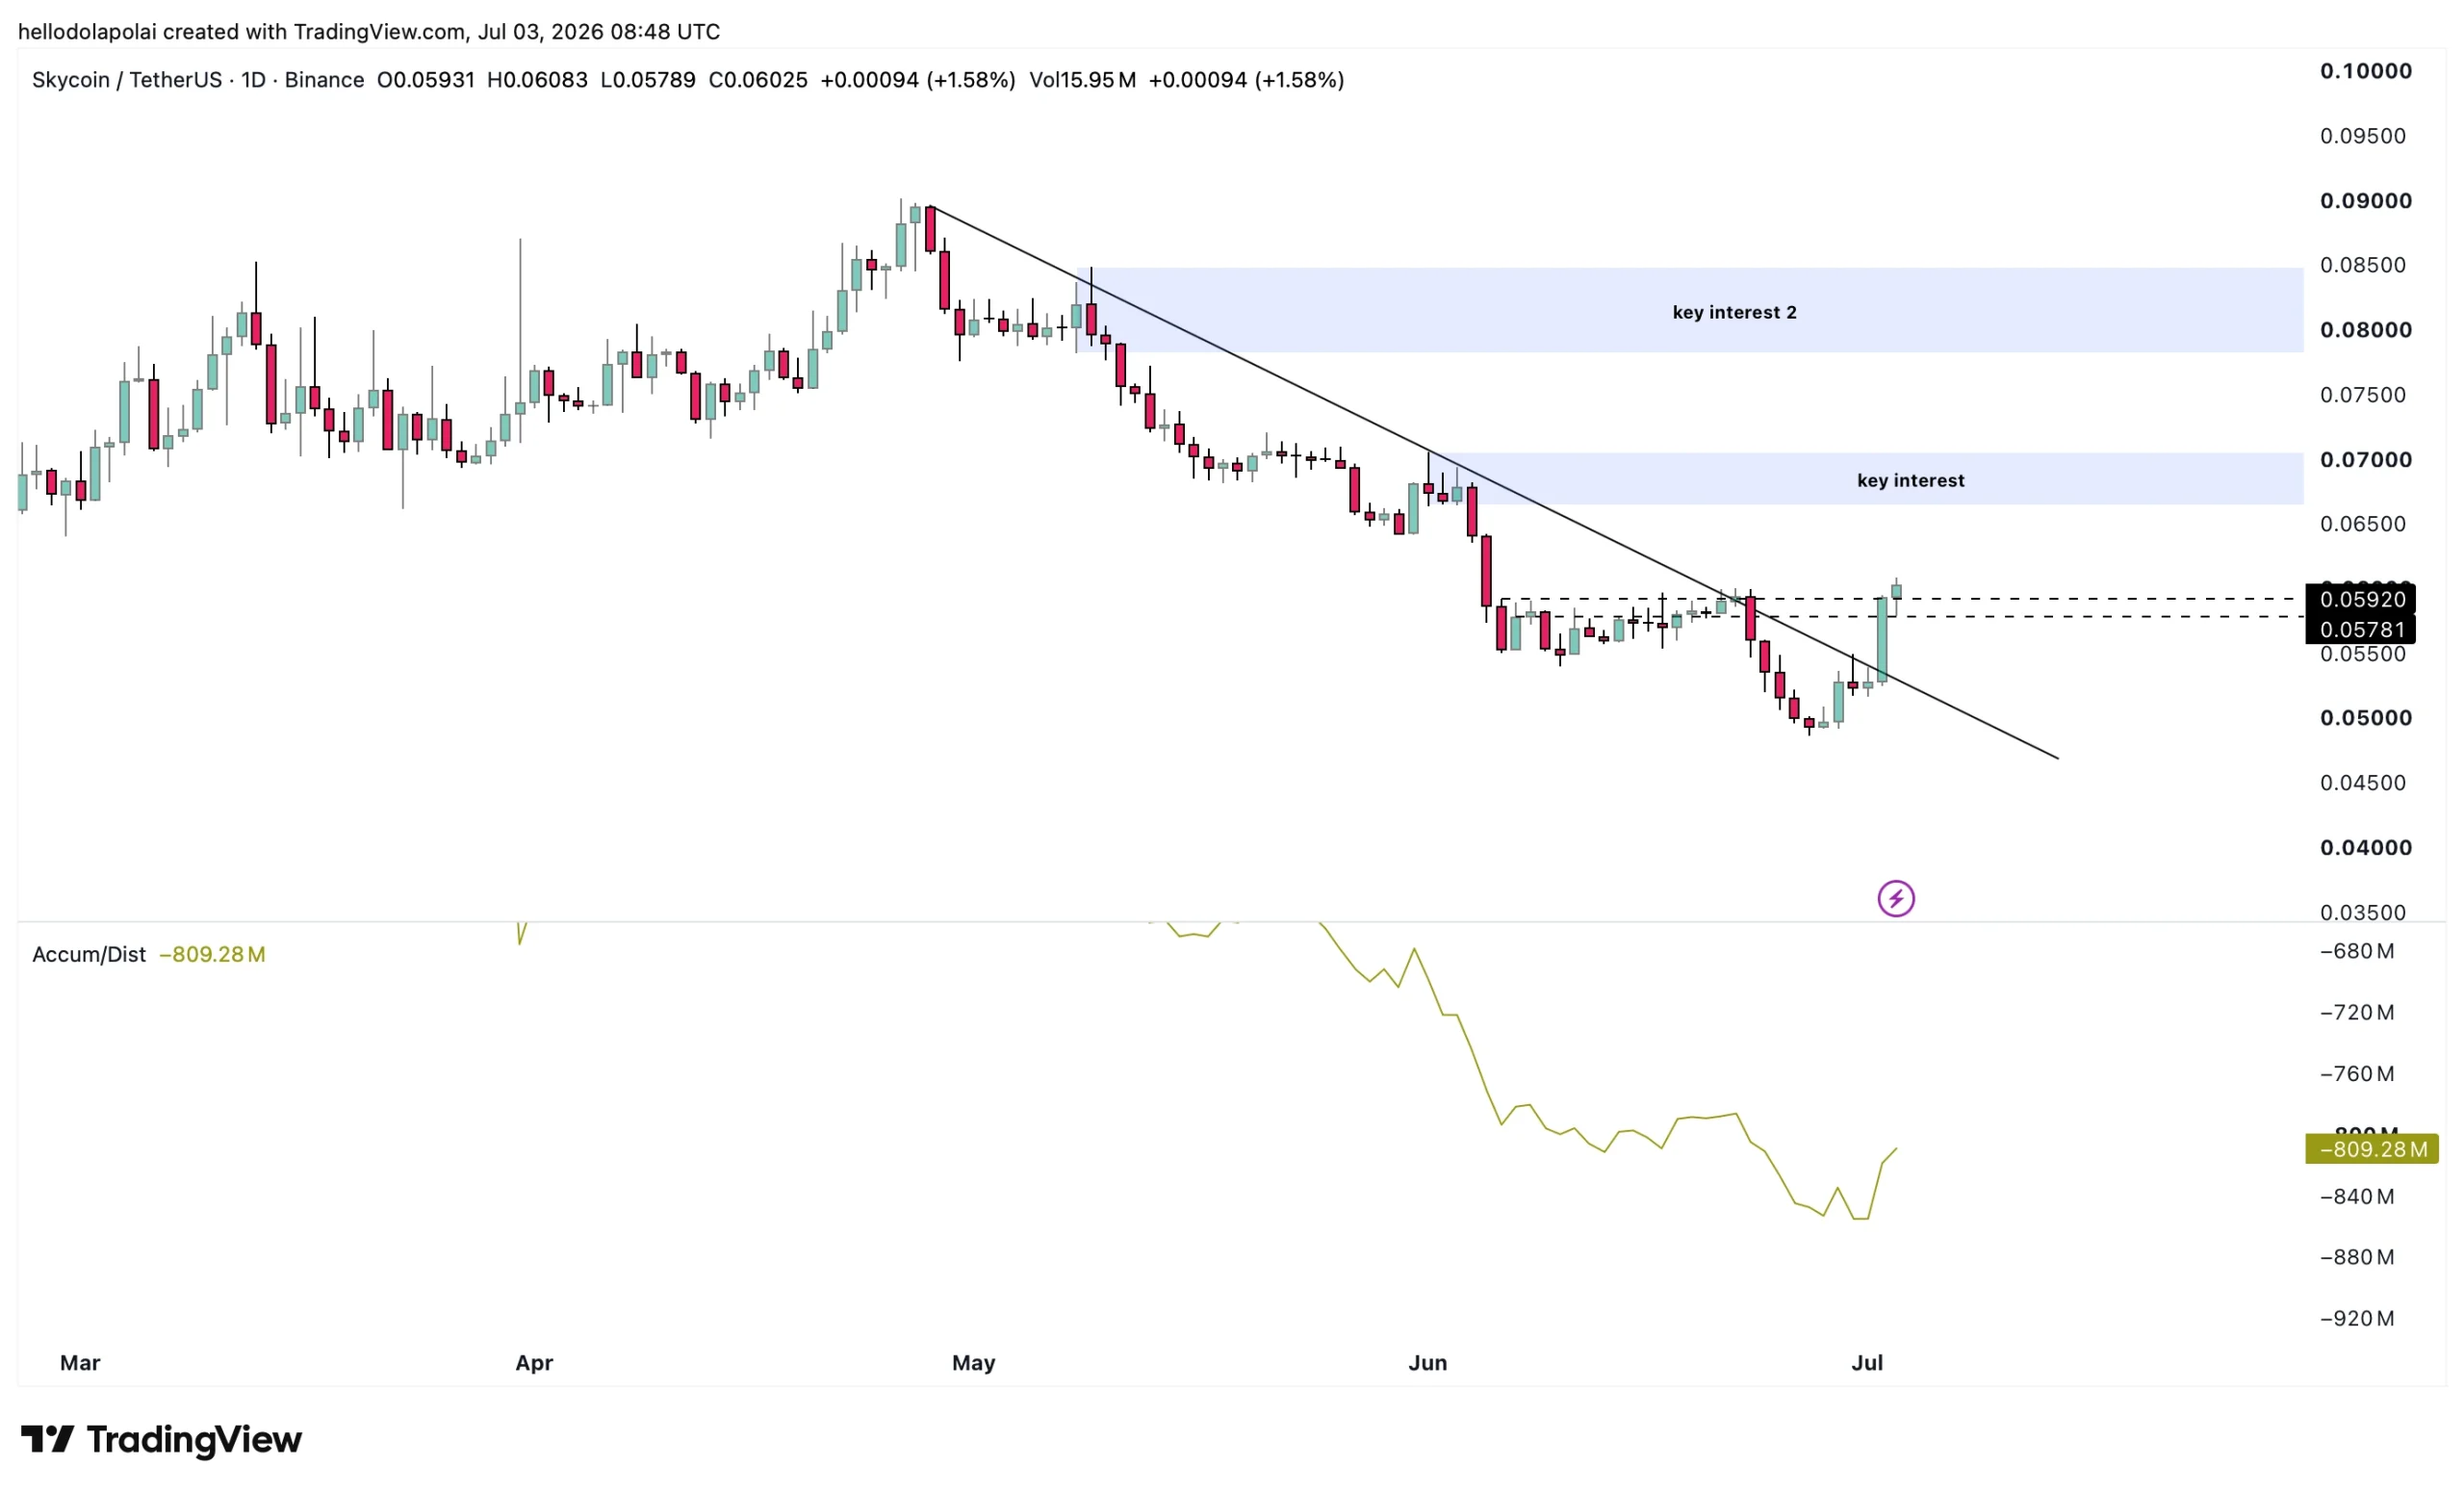
Two key interest levels will come into play if buying pressure continues, indicated by the two boxes on the chart. Removing them would significantly change the price outlook.
At press time, the Accumulation/Distribution indicator – which indicates whether buying or selling dominates – showed the former in control, implying that SKY could force further upside.
Final summary
- SKY soared 20% in a day as money poured into the market suggesting traders could be betting on the rally continuing.
- The increase in volume and the increasing orientation towards buyers suggest real dynamics behind this movement.