


Join our Telegram channel to stay up to date with the latest news
Solana’s price jumped 1.6% in the past 24 hours to trade at $187 as of 3:30 a.m., on an 11% drop in trading volume to $7.13 billion.
The push follows news that Hong Kong has become the first place in the world to approve a Solana spot ETF, beating out the United States as its approvals are slowed by the government shutdown.
🚨 JUST IN: 🇭🇰 Hong Kong has officially approved the first ever $ SOL Spot ETF by ChinaAMC!
Solana just joined the big leagues – institutional money is coming 🟣🔥#Solana #Crypto #ETF pic.twitter.com/y7CUN32aJW
– SMC KAPIL DEV (@smckapildev) October 22, 2025
The approval is a major milestone for the Solana community. The new ETF, managed by ChinaAMC, will begin trading on the Hong Kong Stock Exchange on October 27. Investors will be able to purchase shares of the ETF in US dollars, Chinese yuan or Hong Kong dollars.
With US regulators still reviewing similar products, the move positions Hong Kong as a leader in crypto innovation, which is likely to attract new capital to Solana from retail and institutional investors.
Solana Price: Chain Trends
SOL price dynamics have been influenced by a wave of on-chain activity. The data shows that while there was a slowdown in early October, metrics such as wallet growth, trading volume, and staking participation continue to signal excellent ecosystem health.
Solana’s on-chain statistics remain one of the main reasons for the growing interest. Recent blockchain analytics reveal that: There has been a steady increase in new wallet addresses and overall network transactions, suggesting higher user engagement.
More and more coins are leaving exchanges and heading to private wallets, a sign that long-term holders are accumulating rather than selling.
The number of SOL tokens staked is increasing, providing confidence in the security and future prospects of the network.
Experts note that these on-chain signals are closely followed by traders because increased network activity can lead to new price highs, especially when combined with a positive news cycle like the ETF launch. As a result, coin prices could benefit not only from speculation, but also from actual blockchain adoption and usage.
Solana Technical Analysis: Key Levels to Watch
Looking at the price chart, Solana price is holding above important support levels and remains in an ascending trend channel. The weekly chart shows SOL trading just above two crucial simple moving averages: $183.20 (50-period SMA) and $102.00 (200-period SMA).
These SMAs are typically used by traders to gauge market direction and trend strength.
The $183.20 price forms the first major support zone, supported by the 50-SMA. If the price falls near this level, new buyers tend to step in quickly, pushing it higher.
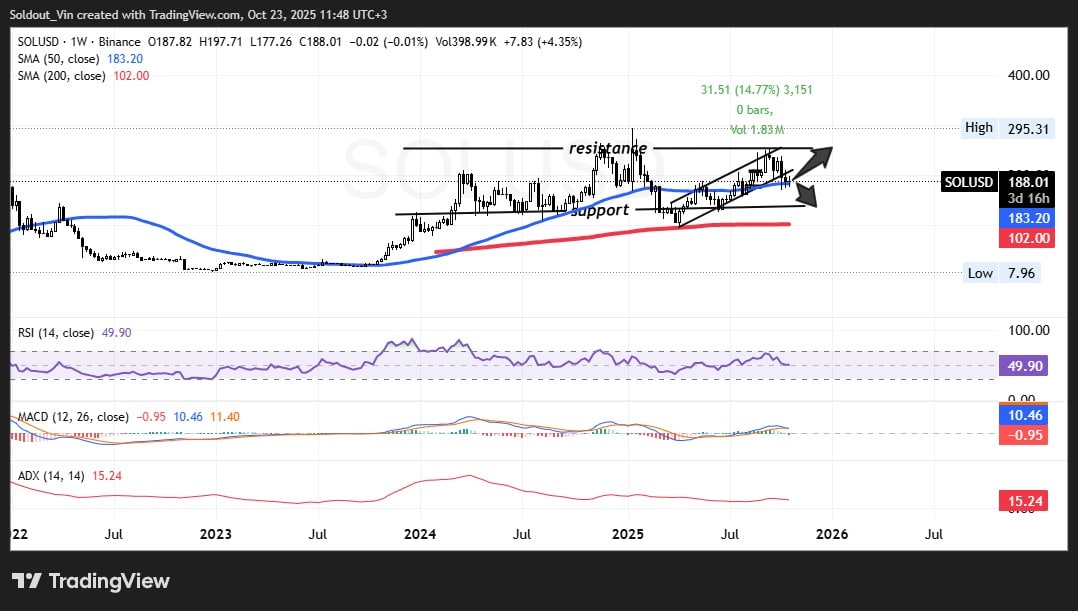
SOLUSD analysis source: Tradingview
A fall below the $183 area could pave the way for a retest of the next major support around $102, as marked by the 200-SMA, although such a decline would likely attract strong demand from long-term holders.
Resistance is currently visible between $195 and $200, with a break above this barrier potentially triggering a move towards the previous high near $295. If the ETF launch results in a stronger price reaction, these targets could appear much more quickly.
Solana Price Indicators Turn Bullish
Technical indicators also signal optimism. The RSI (Relative Strength Index) is near 50, suggesting that the price is neither overbought nor oversold, leaving room for movement in either direction.
The MACD (Moving Average Convergence Divergence) is close to neutral but slowly rising, an indicator that buyers could begin to dominate if the trend strengthens.
Although the ADX (Average Directional Index), currently at 15.24, shows that the trend is not exceptionally strong, a recovery could indicate the start of a major move.
The chart shows an uptrend with a clear support zone at the ascending black line and resistance at the top of the channel. As Solana trades between these lines, the outlook remains positive as long as support levels hold.
If price can break above the upper resistance line, the next main target is $218, with an attempt towards previous highs near $295.
However, if the price stumbles or profit-taking occurs in the market, traders should monitor the $183 and $102 levels for signs of support and long-term buying activity.
Related articles:
Best Wallet – Diversify your crypto portfolio

- Easy-to-use, feature-driven crypto wallet
- Get Early Access to Upcoming Token ICOs
- Multi-chain, multi-wallet, non-custodial
- Now on App Store, Google Play
- Stake to win a $BEST native token
- More than 250,000 active users per month
Join our Telegram channel to stay up to date with the latest news