Close Menu
Altcoin ObserverAltcoin Observer
  • Regulation
  • Bitcoin
  • Altcoins
  • Market
  • Analysis
  • DeFi
  • Security
  • Ethereum
Categories
  • Altcoins (3,567)
  • Analysis (3,675)
  • Bitcoin (4,299)
  • Blockchain (2,157)
  • DeFi (2,623)
  • Ethereum (2,757)
  • Event (119)
  • Exclusive Deep Dive (1)
  • Landscape Ads (2)
  • Market (2,714)
  • Press Releases (12)
  • Reddit (2,847)
  • Regulation (2,474)
  • Security (3,986)
  • Thought Leadership (3)
  • Videos (44)
Hand picked
  • Stellar Testing $0.142 – Why This May Be The Buying Opportunity Traders Have Been Waiting For
  • Bitcoin price hovers around $60,000: Peter Schiff blames Saylor
  • Ispoverse partners with 4AI BNB for a decentralized AI marketplace
  • CAP is available for exchange!
  • Tron traders on alert! THIS decisive level will decide TRX’s next move
We are social
  • Facebook
  • Twitter
  • Instagram
  • YouTube
Facebook X (Twitter) Instagram
  • About us
  • Disclaimer
  • Terms of service
  • Privacy policy
  • Contact us
Facebook X (Twitter) Instagram YouTube LinkedIn
Altcoin ObserverAltcoin Observer
  • Regulation
  • Bitcoin
  • Altcoins
  • Market
  • Analysis
  • DeFi
  • Security
  • Ethereum
Events
Altcoin ObserverAltcoin Observer
Home»Altcoins»Stellar Testing $0.142 – Why This May Be The Buying Opportunity Traders Have Been Waiting For
Altcoins

Stellar Testing $0.142 – Why This May Be The Buying Opportunity Traders Have Been Waiting For

June 26, 2026No Comments
Share Facebook Twitter Pinterest LinkedIn Tumblr Reddit Telegram Email
Share
Facebook Twitter LinkedIn Pinterest Email


Stellar (XLM) extended its decline after sellers maintained firm control despite a pick-up in market activity.

The token was trading at around $0.1514 at press time, reflecting a daily loss of 7.85%, while trading volume climbed 10.55% to $236.47 million. This combination suggests that market participants actively participated in the decline instead of supporting a recovery.

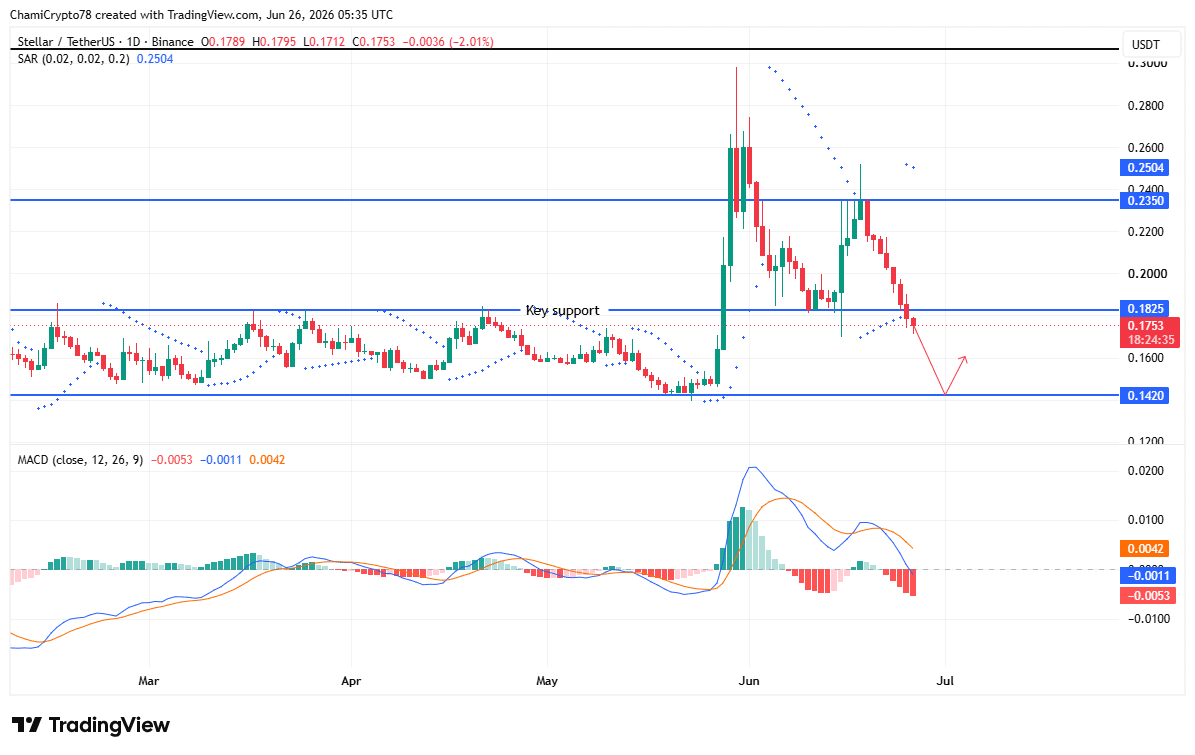
XLM has drifted towards its next demand zone

XLM fell below a key horizontal support after failing to preserve its previous trading structure, leaving the $0.142 demand zone as the next major downside objective.

The price remained below the descending trendline, reflecting continued bearish control across the entire chart.

The MACD maintained a bearish crossover as the histogram remained below the zero line, showing that the downward pressure has not eased despite recent consolidation attempts.

Additionally, the SAR parabolic points continued to form above the candles, reinforcing the existing downtrend instead of signaling a reversal.

Buyers repeatedly attempted to regain lost ground, but each rally stalled below former support, reinforcing the bearish structure.

If sellers maintain control, XLM could continue to drift towards $0.142 before a significant recovery attempt emerges.

Source: TradingView

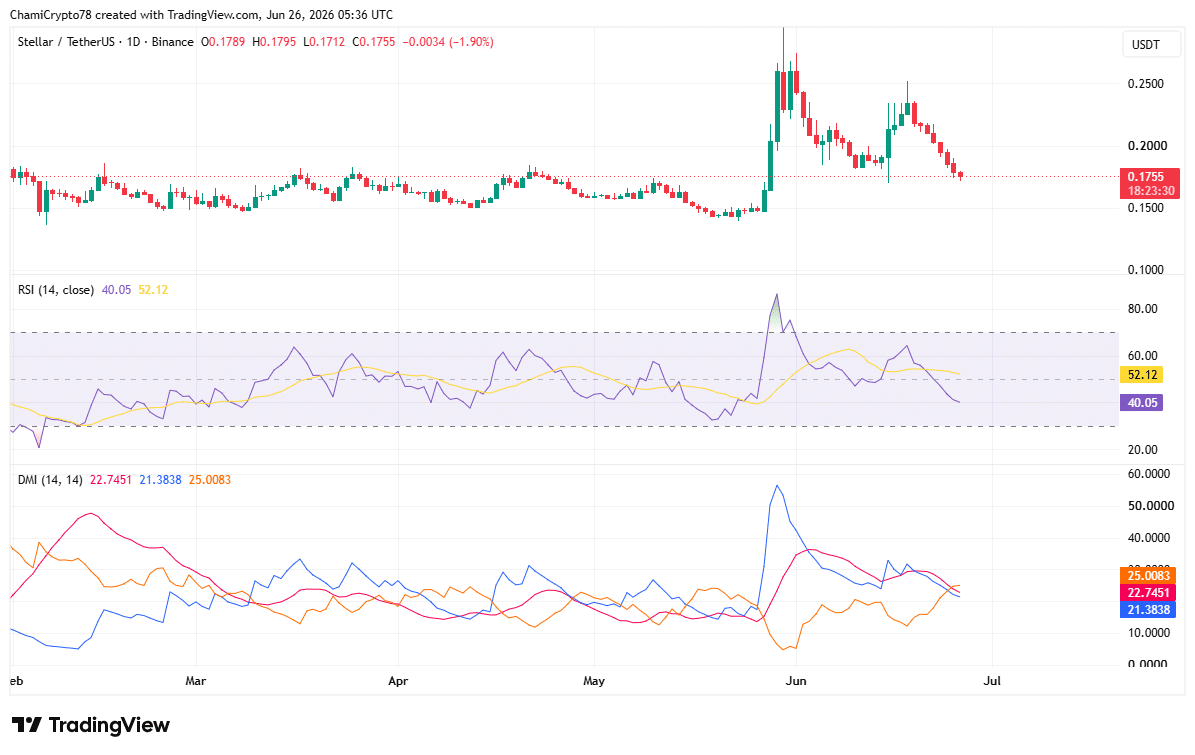
Buyers Weakened While Bears Retained Control

Momentum indicators continued to favor sellers as XLM approached another important technical test.

The relative strength index (RSI) fell to 34.42, placing it near oversold territory after prolonged selling pressure reduced buying participation.

Although the results suggest that the decline has become increasingly widespread, they have not yet confirmed a reversal signal.

Meanwhile, the Directional Movement Index (DMI) showed -DI at 25 remaining well above +DI at 21.38, while ADX climbed to 22.75.

This combination indicates that the dominant downtrend has retained enough strength to remain intact.

Buyers will likely need to regain control of the directional movement before sentiment improves. Otherwise, weakening participation could continue to support a further decline towards the next demand zone.

XLM courseXLM course
Source: TradingView

Is XLM heading towards the $0.142 demand zone?

Current market conditions have favored a further decline towards the $0.142 demand zone before buyers can attempt a sustainable recovery.

Selling pressure dominated both spot order flow and price structure, while trend indicators continued to support the bearish outlook.

However, if buyers successfully defend the demand zone and momentum indicators stabilize, XLM could begin to build a recovery from this zone. Until these signals appear, the pessimistic scenario remains the most likely outcome.


Final summary

  • Increased trading activity has failed to slow XLM’s decline as sellers continue to control the market.
  • XLM could test the $0.142 demand zone before buyers attempt a significant recovery.


Source link

Share. Facebook Twitter Pinterest LinkedIn Tumblr Email
Previous ArticleBitcoin price hovers around $60,000: Peter Schiff blames Saylor

Related Posts

Altcoins

Tron traders on alert! THIS decisive level will decide TRX’s next move

June 26, 2026
Altcoins

Bitcoin vs Altcoins: Key Differences Every Crypto Investor Should Know – Cryptocurrency News

June 26, 2026
Altcoins

Examine if STABLE’s uptrend is sustainable after its latest 5% price increase

June 26, 2026
Add A Comment
Leave A Reply Cancel Reply

Single Page Post
Share
  • Facebook
  • Twitter
  • Instagram
  • YouTube
Featured Content
Event

Dutch Blockchain Week 2026 strengthens position as Europe’s leading B2B blockchain event week

April 14, 2026

Amsterdam, April 2026 – Dutch Blockchain Week 2026 is rapidly evolving into one of Europe’s…

Event

Global Games Show Riyadh: The Ultimate Creator & Influencer Hub

March 31, 2026

The fast-evolving gaming ecosystem of Riyadh is powered by solid national investment, a flourishing esports…

1 2 3 … 82 Next
  • Facebook
  • Twitter
  • Instagram
  • YouTube

Stellar Testing $0.142 – Why This May Be The Buying Opportunity Traders Have Been Waiting For

June 26, 2026

Tron traders on alert! THIS decisive level will decide TRX’s next move

June 26, 2026

Bitcoin vs Altcoins: Key Differences Every Crypto Investor Should Know – Cryptocurrency News

June 26, 2026
Facebook X (Twitter) Instagram LinkedIn
  • About us
  • Disclaimer
  • Terms of service
  • Privacy policy
  • Contact us
© 2026 Altcoin Observer. all rights reserved by Tech Team.

Type above and press Enter to search. Press Esc to cancel.

bitcoin
Bitcoin (BTC) $ 59,885.00
ethereum
Ethereum (ETH) $ 1,578.19
tether
Tether (USDT) $ 0.998555
bnb
BNB (BNB) $ 567.02
usd-coin
USDC (USDC) $ 0.999578
xrp
XRP (XRP) $ 1.04
solana
Solana (SOL) $ 72.90
tron
TRON (TRX) $ 0.319721
figure-heloc
Figure Heloc (FIGR_HELOC) $ 1.02
staked-ether
Lido Staked Ether (STETH) $ 2,265.05