




Ethereum is back to a point on its Bitcoin pair where price action has always begun to pose a dangerous question: Is ETH still weak, or is its price being priced for another rotation?
A new ETH/BTC chart shared by crypto analyst BLADE shows that Ethereum has fallen through 14 consecutive lower closes against Bitcoin, placing the pair below the same area of relative strength at its February low. The setting is important because the last visit to this area was at a time of great pessimism around Ethereum. A few weeks later, ETH began to outperform Bitcoin, and the move ultimately took Ethereum above $2,450.
Ethereum returns to the same ETH/BTC buying zone
BLADE the analysis focuses on the Ethereum/Bitcoin pair, where ETH entered a clear short-term breakout against BTC after weeks of consistent underperformance. The pair was trading above 0.0313 in April, but that level gave way as sellers continued to put pressure on Ethereum relative to Bitcoin.
Related reading
By May, ETH/BTC had fallen below 0.027 after posting 14 consecutive lower closes, taking it to its lowest level since July 2025. This decline means that the price of Ethereum has not only fallen in dollar terms or struggled with the broader crypto market, but has also lost ground directly against Bitcoin.
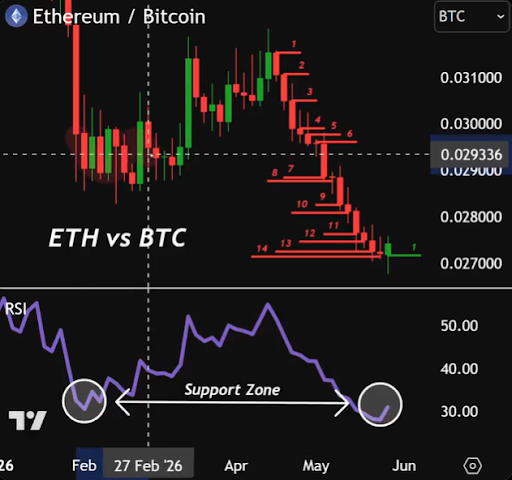
However, the most recent red candle on the ETH/BTC pair turned out to be a doji candlestick, which is the ultimate indecision candlestick. The current candlestick is still green and Ethereum price is now in a position to outperform Bitcoin price.
Interestingly, the deepest point in BLADE’s analysis is where the decline has taken the pair. The ETH/BTC RSI has returned to the same support zone that appeared around the February low, near the indicator’s lower 30s. This area is highlighted on the chart below as the area where momentum expanded enough in February that Ethereum could begin to rally against Bitcoin.
What’s next for Ethereum?
At the time of writing, the ETH/BTC pair is trading at 0.02835, approximately 35% below its August 2025 high of 0.0434. This was the last time Ethereum price was in a period of peak outperformance against Bitcoin, leading to a breakout above $4,000 and its current all-time high of $4,946.
Related reading
Ethereum’s current configuration is not the same as August 2025, but the the rhythm is quite similar. The pair returned to the same dynamic support zone and the lower closing sequence stretched. The pair must now stop printing lower closes and recover the breakdown zone, and Ethereum starting to see more influx compared to Bitcoin, especially since BTC now has it broken below $70,000 in the last 24 hours.
However, Ethereum has also not been immune to broader market weakness, with ETH also falling below $2,000 in the last 24 hours.
Featured image from Freepik, graphic from Tradingview.com


