



Key takeaways
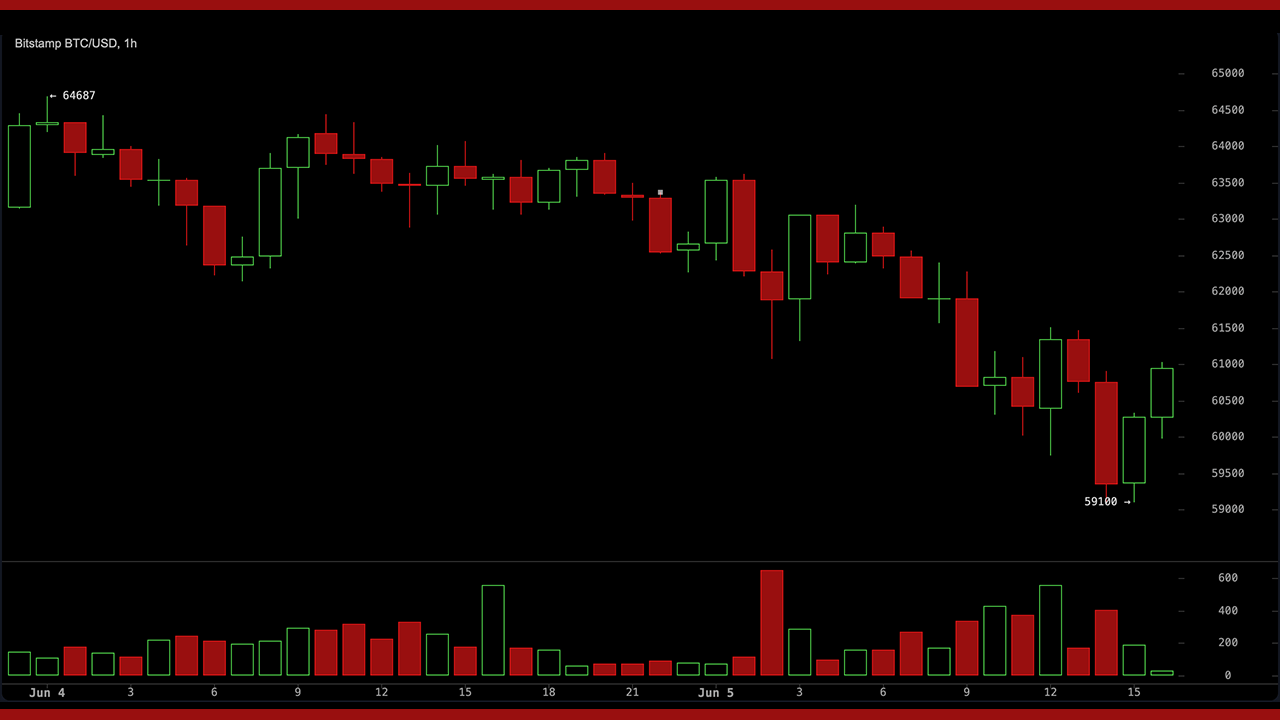
- Bitcoin hit a 2026 intraday low of $59,100 on June 5, falling 19.3% in 7 days and 26.8% in 30 days.
- Coinglass data shows $1.75 billion in liquidations in 24 hours, with 351,233 traders wiped out across crypto markets.
- More than half of all BTC is now experiencing an unrealized loss, a signal that has marked every major bear market low in Bitcoin history.
Bitcoin Drops 19% in 7 days and hits $59,100
The move extended a strong sell-off that lasted bitcoin down 19.3% in seven days, 22.2% in the last fortnight and 26.8% in the last month. Over the past year, the price has fallen by 42.3%. The latest put range of $59,000 to $60,000 bitcoin well below the $71,000 level it was trading at four days earlier, on June 1.
Liquidations flood the market
Liquidation Coinglass data shows $1.75 billion in total crypto liquidations over the past day, with long positions accounting for $1.45 billion of that figure. Bitcoin alone absorbed $560.72 million in liquidations ($448 million long), followed by Ethereum at $473.02 million ($408 million long). The greatest single liquidation the order was a BTCUSDT position on Binance worth $13.31 million. As of 4 p.m. EDT, over the past four hours, $411.68 million has been liquidated, with long positions accounting for $329.21 million of that total.
Pupil leverage in perpetual futures exposed traders as prices broke through key support levels. The cascade that followed is a well-documented pattern in crypto corrections: stops are triggered, prices fall further, more stops are triggered.
ETF Exits and Strategy Selling
Institutional pressure was a central driving force. American spot bitcoin Exchange-traded funds (ETFs) saw estimated net outflows of between $2.8 billion and $3.5 billion over 10 to 11 consecutive trading sessions in late May and early June, with a single week recording approximately $3.4 billion in redemptions, the largest single-week outflow since ETF products launched in early 2024. Blackrock’s IBIT was among the products that saw significant redemptions.
Another psychological blow came from Strategy, formerly Microstrategy. The company disclosed in a June 1 filing with the U.S. Securities and Exchange Commission (SEC) that it sold 32 BTC between May 26 and May 31 at an average price of approximately $77,135 per coin, generating proceeds of approximately $2.5 million. The sale, the first net of the company bitcoin sale since 2022, was used to finance distributions on its STRC perpetual preferred shares. The strategy still holds over 843,700 BTC at an average cost of around $75,699.
The economic impact of 32 pieces is minimal. The narrative impact was not. The Strategy brand was built largely on a commitment to no sales, and the filing shattered that image for part of the market. Retail followed. Many believe that now that the ice is broken, more sales could follow.
200-week moving average breaks
Bitcoin has now fallen below its 200-week moving average for the first time since June 2022, exactly four years ago. This level has historically served as a floor of long-term support and a marker of cycle lows.
Onchain data adds weight to the moment: more than half of all bitcoin outstanding is now held at an unrealized loss. This reading coincided with every major bear market down bitcointhe story. Whether this signals a bottom or marks the start of a deeper decline depends on the continuation of inflows, macroeconomic conditions, and price action at current support levels.
Social media account and Cryptoquant contributor Darkfrost, posting on X, reported that bitcoin transaction volume nears all-time high based on 30-day moving average, even as correction deepens, calling it “one of the most significant changes of hands” bitcointhe story.
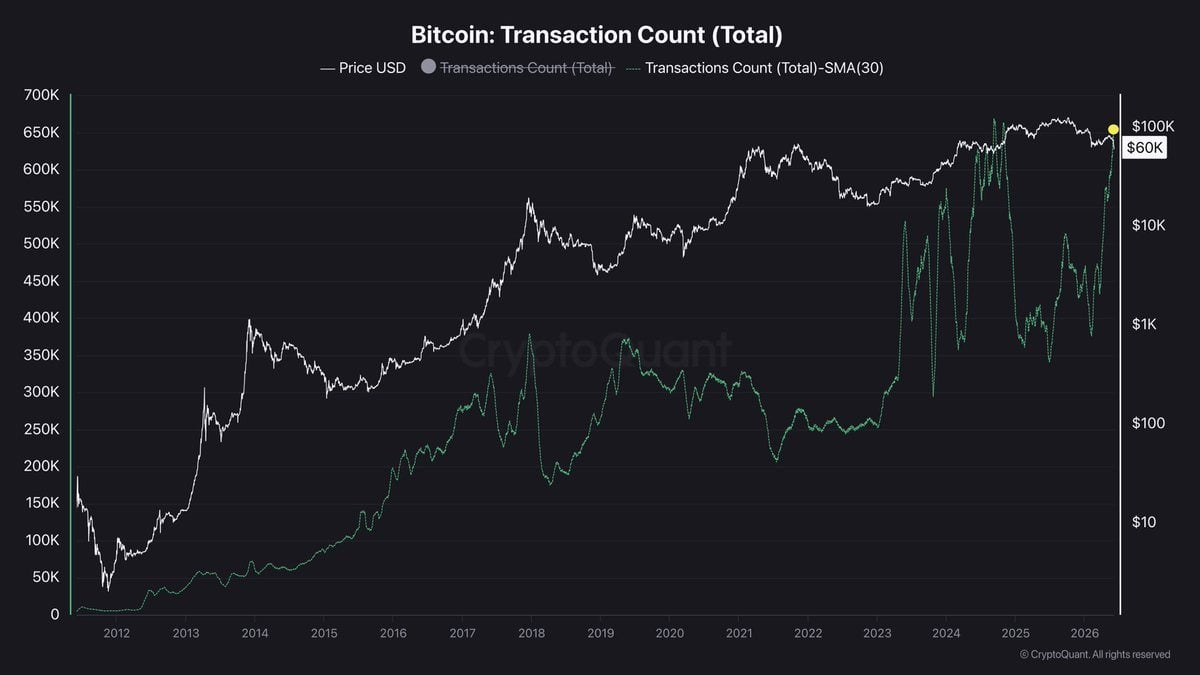
The average monthly number of transactions reached around 640,000, a level reached only once before, in September 2024 during that year’s correction, when 666,000 transactions were recorded. Darkfrost noted that the timing was unusual: in previous cycles, the increase in the number of transactions usually coincided with bullish phases or market peaks, without accelerating declines.
With June already down about 19%, Darkfrost presented the activity as a surrender event rather than a surrender event. bullish signal, writing:
“It is rather an episode of capitulation and a significant change of hands. »
Fear dominates the feeling
THE Cryptocurrency The Fear and Greed Index fell to a value between 11 and 15 during the first week of June, placing it firmly in extreme fear territory. As of today, the Cryptocurrency The Fear and Greed Index hosted on alternative.me says the score is currently 12. Comments on social media have been dominated by references to selling, criticism of leveraged positioning, and questions about MSTR’s strategic credibility.
According to Google Trends data, the search term “ bitcoin» reached a world record score of 100 over the past week.
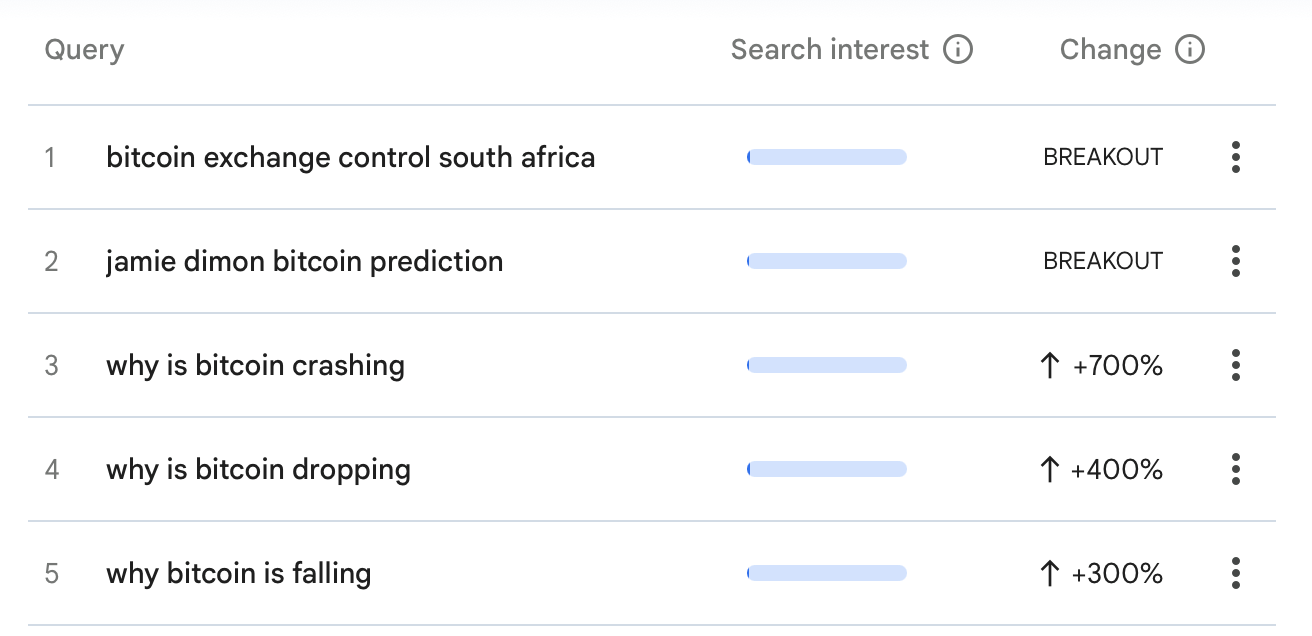
Such reading demonstrates a pronounced increase in public curiosity. The underlying data helps explain the phenomenon, as the associated research is mostly focused on price developments. Top query trends related to the term “ bitcoin» include “why bitcoin crashes”, “why bitcoin fall” and “why bitcoin is falling.
macro backdrop
Broader conditions didn’t help. Escalating geopolitical tensions involving the United States and Iran have pushed up oil prices, making the situation worse. inflation concerns and complicate the Federal Reserve’s rate policy. Expected rate cuts have been delayed and some Fed officials have refused to rule out further hikes. This environment has put general pressure on risky assets, and bitcoin was not safe.
AI Rotation Could Drive Capital Away Bitcoin
The rotation of capital into artificial intelligence (AI) stocks has added another layer of selling pressure. Institutional and speculative investors withdrew their venture capital from the market. bitcoin and in stocks related to AI, semiconductor sectors and data center infrastructure, where near-term earnings growth and clearer catalysts have made the opportunity cost of holding BTC I feel too high.
Many observers have directly flagged this dynamic, noting that investors are favoring AI stocks and upcoming tech IPOs. crypto and warning of a potentially turbulent summer ahead for bitcoin. Strategy Chairman Michael Saylor addressed the shift in a June 4 article on Bitcoin ETFs capital outflows since May 14 reflect a turnover of capital rather than any depreciation of capital. bitcointhe fundamentals.
Saylor framed the volatility as an opportunity. Many long-term holders share this view, pointing to previous cycles where capital reverted to Bitcoin once enthusiasm for AI cooled or macroeconomic conditions improved.
What analysts are looking at
Analysts view $60,000 as a critical support level. A consistent and sustained break below that opens the door to tests around $58,000. Some have noted that liquidity near $53,000 makes this level a potential magnet if selling continues, with the possibility of a wick below $50,000 if this zone is reached.
On the other hand, oversold RSI values on the daily charts, historically rare levels around 17 to 18, preceded strong rallies in previous cycles. A reversal in ETF flows, any de-escalation of geopolitical tensions or clarity on Federal Reserve policy could provide the catalyst for a relief rally.
ETFs still hold significant lifetime inflows despite the recent spate of redemptions. Long-term holders have not shown widespread capitulation. The data suggest caution, not certainty, about the direction to take. As of 4:30 p.m. EDT on Friday, bitcoin hit $61,120 per coin after gaining a percentage point over the past hour.
In the meantime, everyone holds their breath.


