


Join our Telegram channel to stay up to date with the latest news
The price of
This comes even as two major XRP ETFs prepare to launch this week.
Franklin Templeton is expected to launch its XRP ETF tomorrow, while Bitwise will launch its fund on November 20, raising hopes that new institutional inflows into the funds could help bolster the beleaguered crypto.
Canary Capital’s XRP ETF (XRPC), which debuted Thursday, was the biggest ETF launch of the year, with first-day trading of $58 million.
XRP Price: On-Chain Activity Increases
Although XRP’s price performance disappointed traders last week, on-chain signals indicate increasing network activity. The number of active addresses on the XRP Ledger jumped 40% this week, reaching around 32,000. A strong sign of growing interest even as the price falls

Source of active XRP addresses: CryptoQuant.
There was also a 200% increase in network volumes, with almost 2.56 billion XRP flowing between wallets and exchanges in just 24 hours.
Large investors have been very active, executing 716 massive transfers and moving around 200 million XRP in two days. This level of activity usually precedes a strong price movement, although the direction is not yet clear.
Traders are watching the $2.20-$2.00 support zone and the $2.35-$2.60 resistance zone as both coincide with key moving averages and previous highs.
When buyers become so active but the price doesn’t immediately increase, it often means they are preparing for a bigger change. These signs: more active addresses, rising volume and whale movements, suggest that sentiment is not as negative as falling prices might appear.
XRP Price XRP Technical Analysis: Range-bound, but support is key
The XRPUSDT weekly chart reveals continued volatility, but also clears areas where the price is likely to find support. Currently, XRP is trading near $2.28, recovering from a brief decline to around $2.07 earlier in the week. Strong buying quickly reversed the decline, showing buyers are defending key support levels.
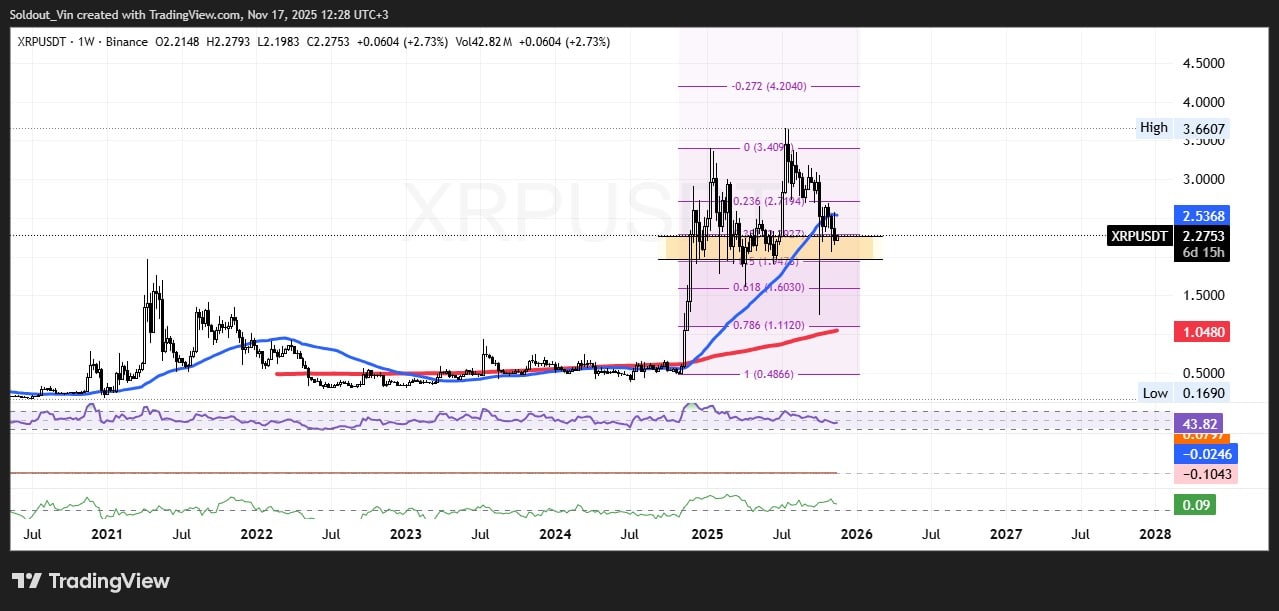
XRPUSDT analysis source: Tradingview
There are several critical technical levels in play: Immediate support lies between $2.20 and $2.00. Over the past few sessions, every time XRP approached $2.07, new buyers stepped in and the price rebounded.
The main resistance lies at the $2.35 to $2.60 band. If the price can rise above $2.58, a move to $2.76 becomes likely, and then eventually to $2.89 or even higher.
The relative strength index (RSI) shows rapid fluctuations. Recently, the RSI was as low as 31.76, an area known as sell saturation, suggesting that any continued decline could soon reverse to the upside as traders buy into oversold conditions.
The MACD indicator hints at consolidation. With the blue MACD line remaining close to the red signal line, this could mean a sideways phase or slight rebound before any major breakout.
On the long-term chart, XRP remains above most major moving averages, and past ETF launches for other coins (like Bitcoin) have seen price declines eventually followed by rises. This confirms experts’ predictions that recent ETF launches, even if they result in sales at first, can help fuel a recovery once new investors enter.
If volatility persists and XRP falls below $2.00, downside risk could emerge. But as long as the price remains above the support zone, XRP could recover and move back towards the $2.58 to $2.76 resistance zone.
Related articles:
Best Wallet – Diversify your crypto portfolio

- Easy-to-use, feature-driven crypto wallet
- Get Early Access to Upcoming Token ICOs
- Multi-chain, multi-wallet, non-custodial
- Now on App Store, Google Play
- Stake to win a $BEST native token
- More than 250,000 active users per month
Join our Telegram channel to stay up to date with the latest news