



Join our Telegram channel to stay up to date with the latest news
The price of
XRP has reclaimed prices above $2, increasing its market capitalization to approximately $123 million annually. CoinMarketCap. This puts it back in third place among crypto assets, ahead of BNB with a market value of over $120 million.
💥 BREAK:$XRP FLIPS BNB TO BECOME THE 3RD LARGEST CRYPTOCURRENCY IN THE WORLD BY MARKET CAPACITY! pic.twitter.com/3CSZqtaYbi
– STEPH IS CRYPTO (@Steph_iscrypto) January 3, 2026
The recent rally comes as the digital assets market shows renewed strength, as the crypto space surged more than 2% to reach a market cap of $3.07 trillion. This surge allowed BTC to bounce above the psychological resistance at $90,000, while ETH continued to trade above the $3,000 zone.
Additionally, US spot XRP exchange-traded funds (ETFs) continue to defy market volatility, maintaining a perfect streak of daily entries, according to SoSoValue data.
Can XRP price continue to soar in the long term?
XRP Price Breaks Out – Poised for Sustained Rise
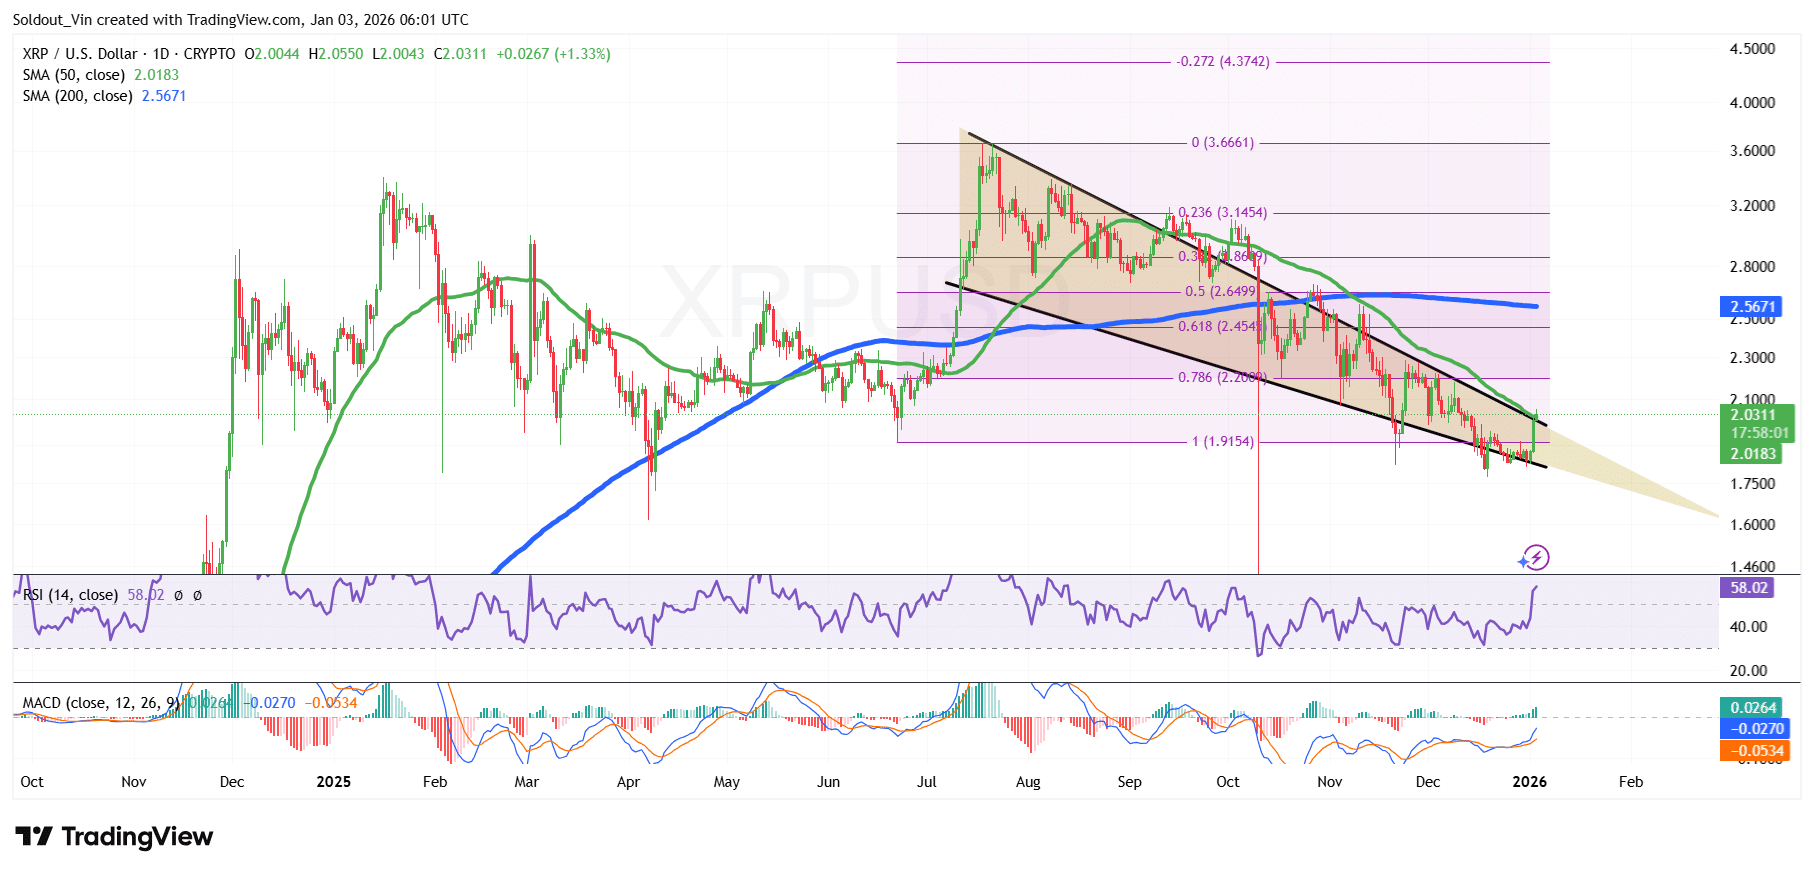
THE XRP Price is showing signs of a sustained move higher after breaking out of the falling wedge pattern and continuously trading above the lower Fibonacci support level at $1.91.
This rise comes as the price of the Ripple token sees a recovery, following a sustained downtrend that saw XRP plunge from an all-time high of around $3.66.
XRP’s decline was further fueled when XRP price fell below the 50-day and 200-day simple moving averages (SMA), forming a death cross around $2.63.
The decline pushed XRP price to break through important Fibonacci support levels, with $1.90 serving as a recent area of demand.
This zone allowed the bulls to recover, as the price of the Ripple token broke out of the descending wedge and crossed the 50-day SMA ($2.01).
The Moving Average Convergence Divergence (MACD) has also turned bullish, with the blue MACD line successfully crossing the orange signal line. The green bars formed above the neutral line also show that buyers are stepping in to generate positive momentum.
At the same time, the Relative Strength Index (RSI) is also supporting a bullish rally as it has broken above the mid-level of 50 to reach the current level around $58, which shows that buyers are actively entering the market.
Ripple Token Price Outlook
Based on the XRP/USD chart analysis on the daily time frame, XRP price is poised for a sustained recovery after breaking the descending wedge trend and the 50-day SMA.
Supported by the positive indicators, the Ripple token could rise further, as it targets key resistance levels on the Fibonacci retracement chart, the next being around $2.2 and $2.45, on the 0.786 and 0.618 Fib zones. A continued rally could see XRP rise to the 200-day SMA at $2.56.
Conversely, if the RSI climbs and reaches an overbought zone, sellers could start taking profits from the rise, which could see the Ripple token fall back to the $1.90 support zone.
A decline below this zone could see XRP plunge towards the previous support zone around $1.79, acting as a cushion against downward pressure.
Related news:
Best Wallet – Diversify your crypto portfolio

- Easy-to-use, feature-driven crypto wallet
- Get Early Access to Upcoming Token ICOs
- Multi-chain, multi-wallet, non-custodial
- Now on App Store, Google Play
- Stake to win a $BEST native token
- More than 250,000 active users per month
w
Join our Telegram channel to stay up to date with the latest news


