



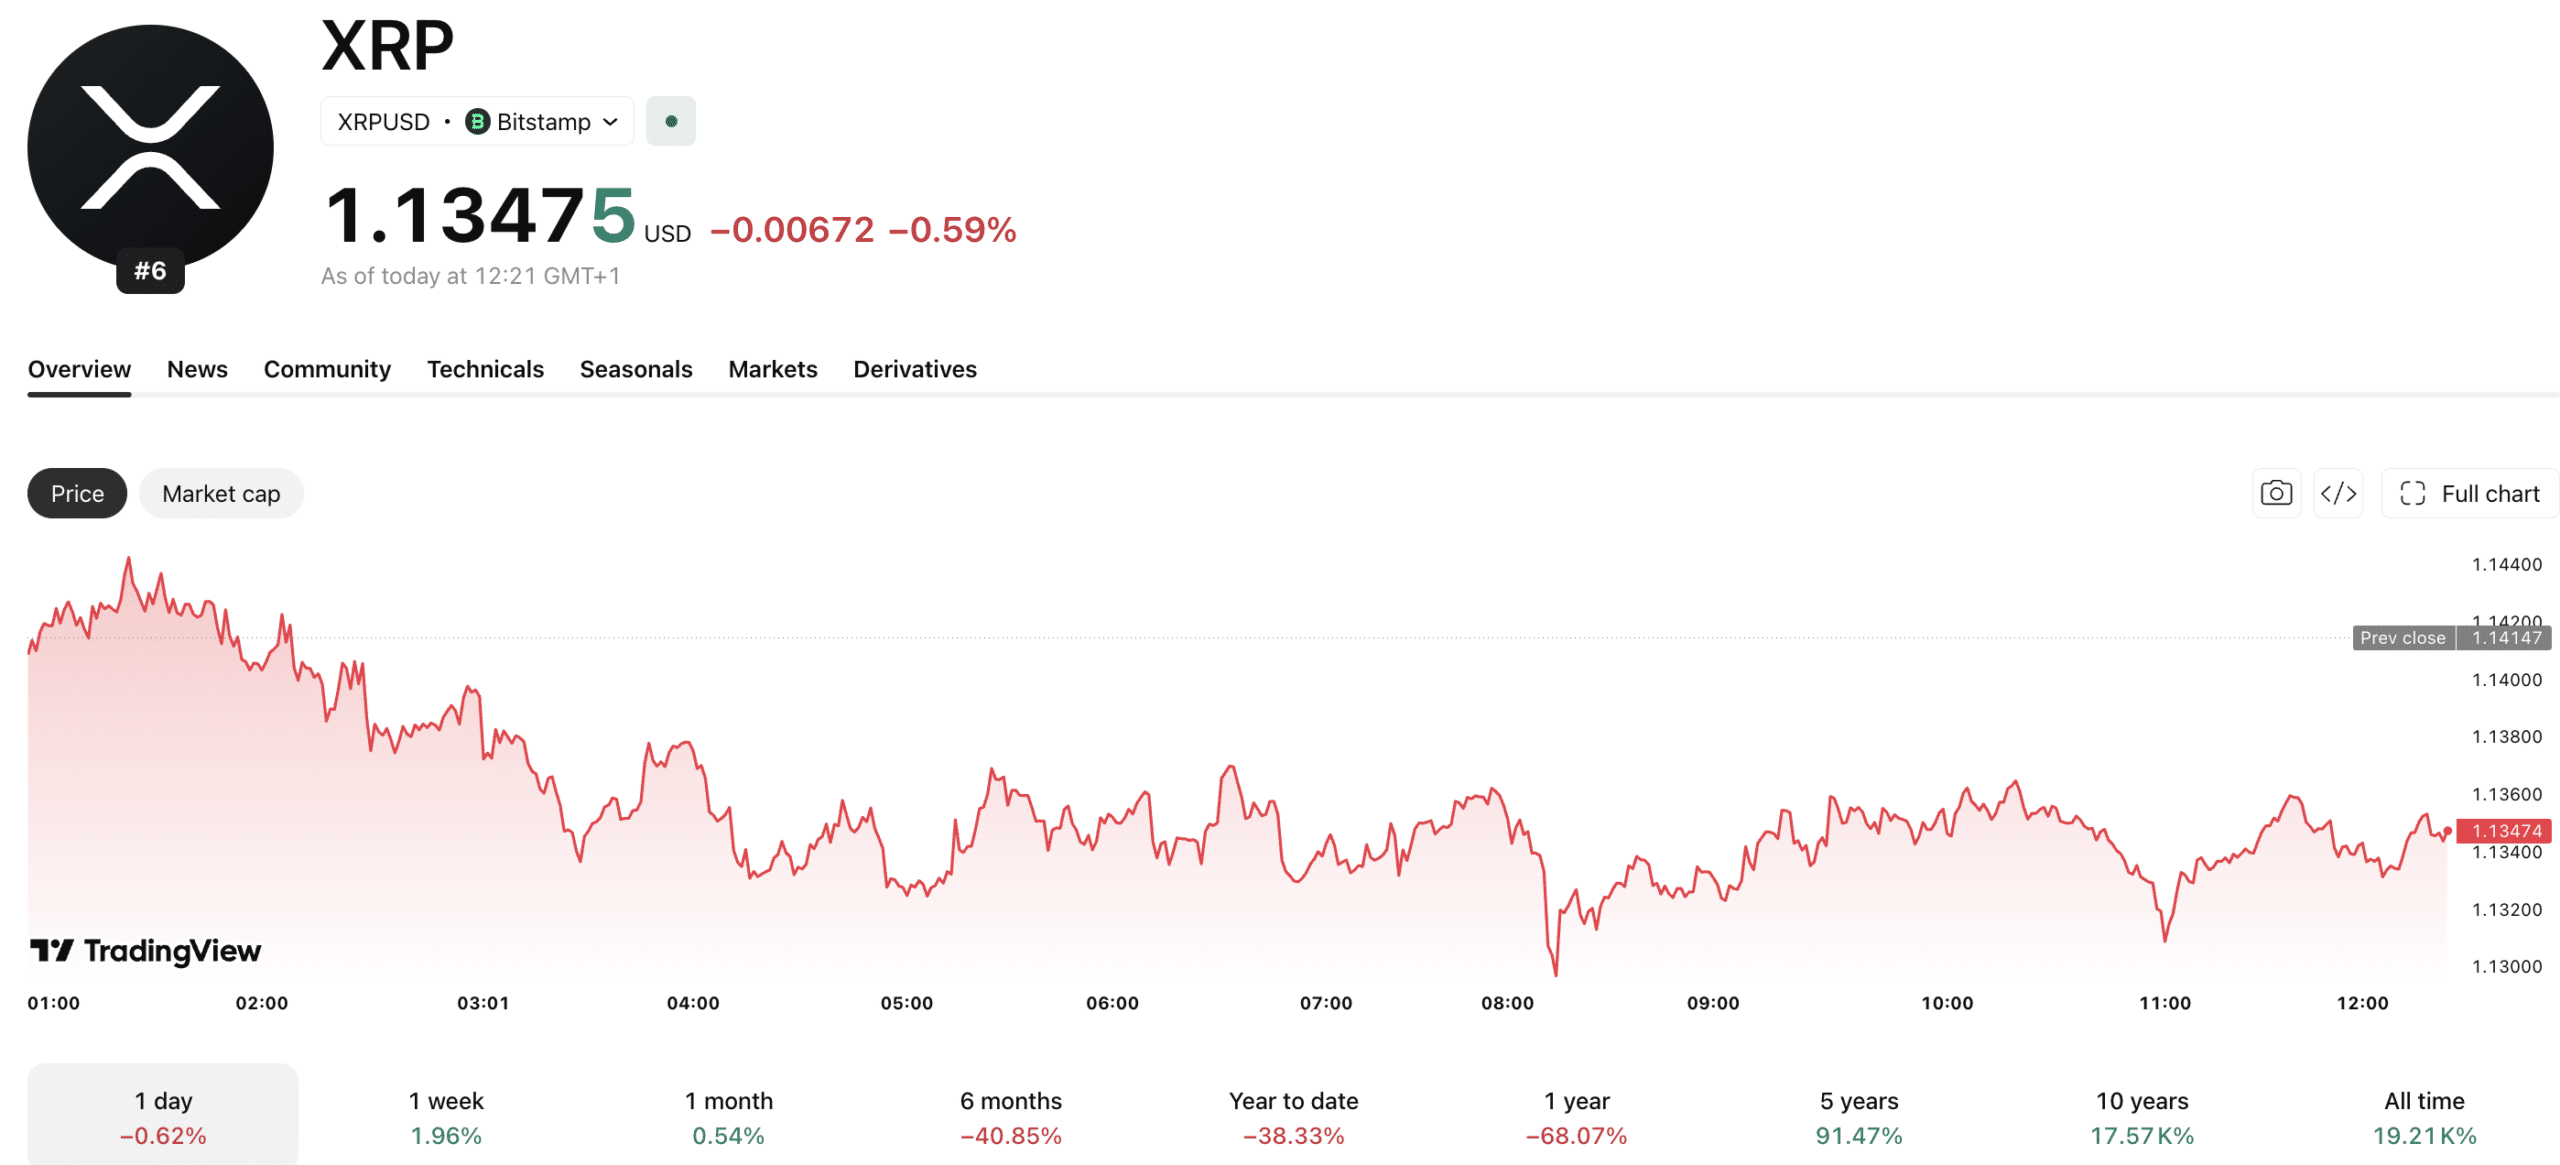
In today’s XRP news, Ripple has slipped since July 21 but remains around $1.13, tracing a cup and handle formation on the daily chart, with $1.15 as the breakout trigger and $1.21 as the pattern target.
The setup looks clean. This is not the case with the flow of institutional money behind it. This gap between chart structure and the capital that supports it is the central tension currently shaping XRP trading.
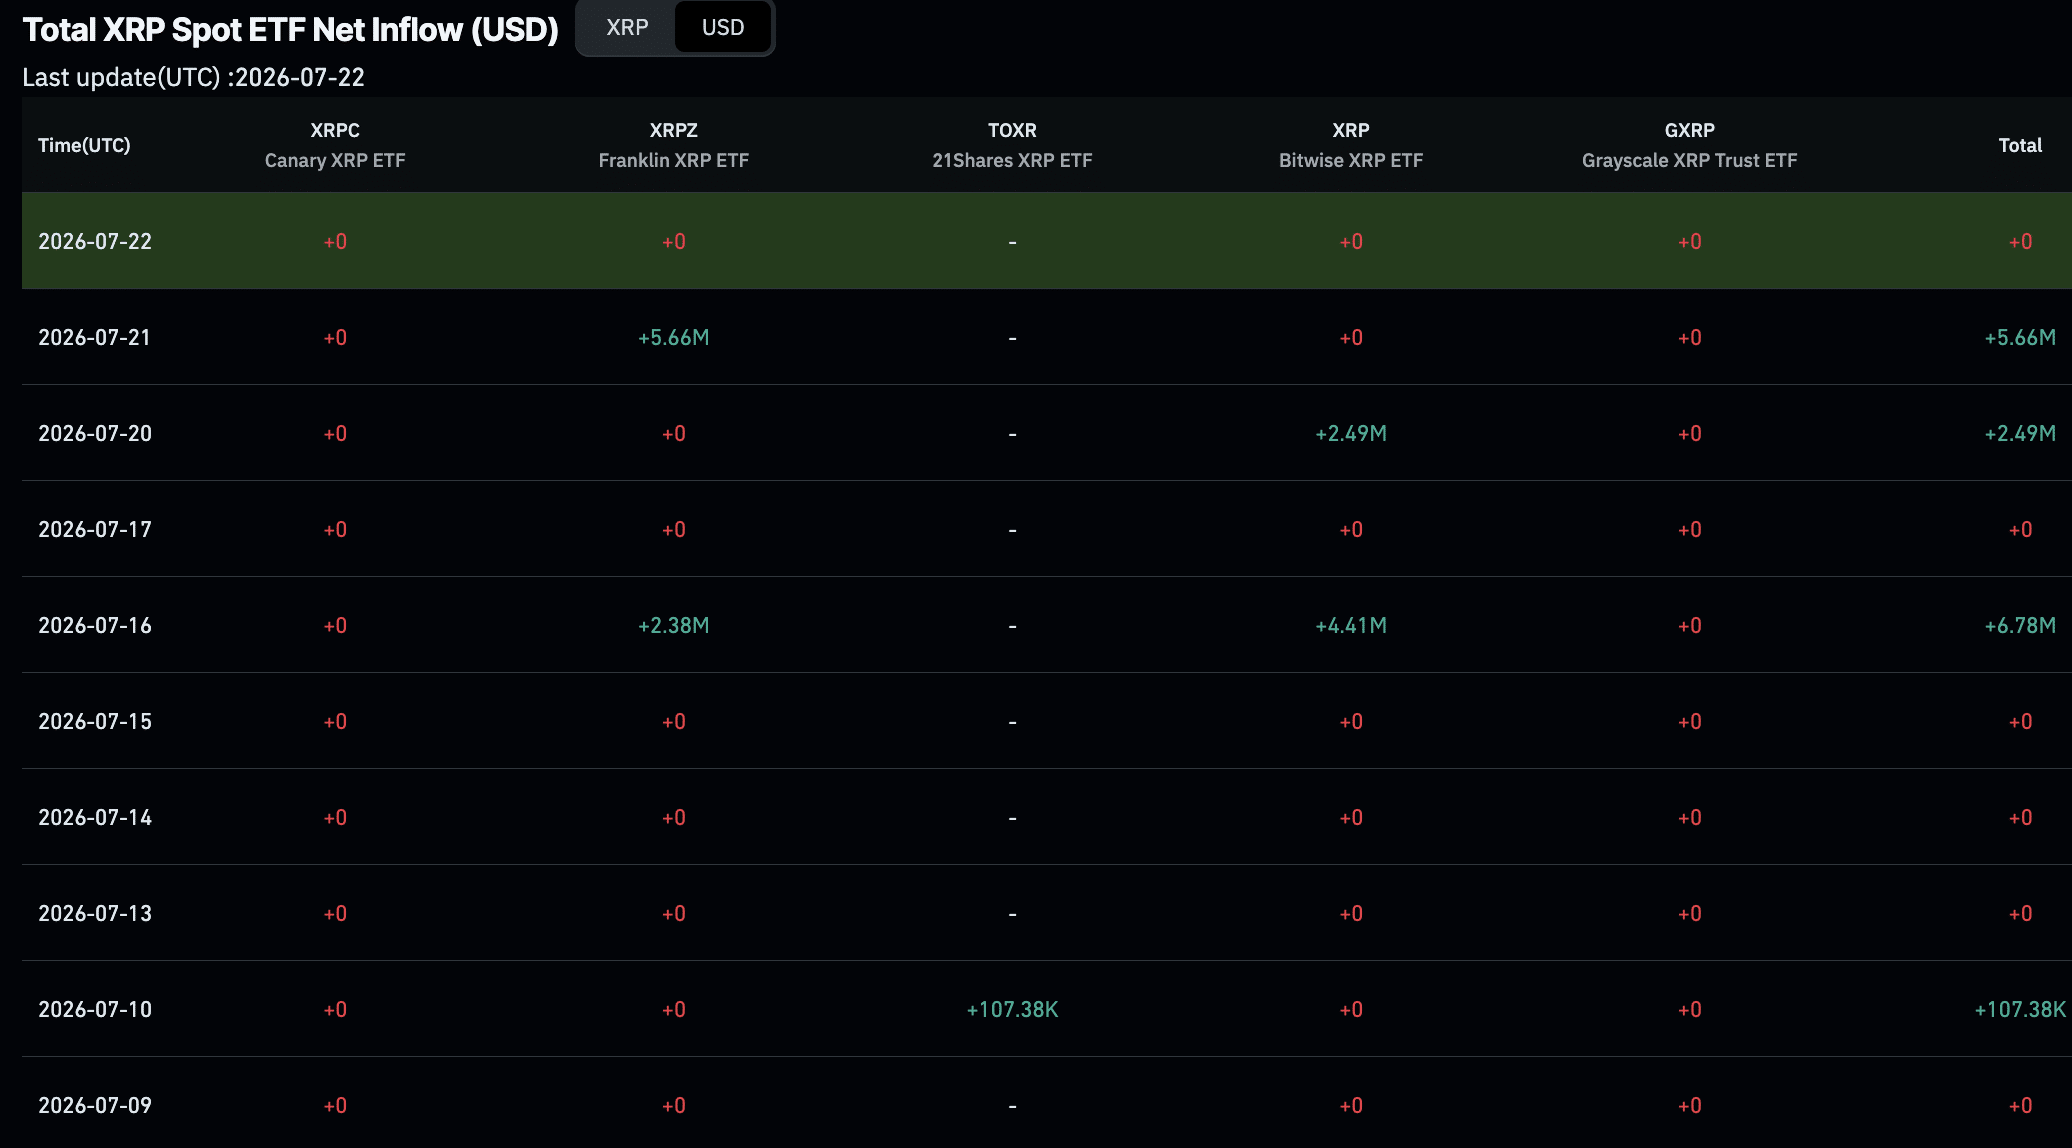
According to CoinGlass data, monthly XRP ETF spot inflows collapsed from a high of $131.94 million in May to just $12.43 million in July, the lowest month on record. Capital inflows remain technically positive, but it is not a technicality worth glossing over.
XRP News: The Cup and Handle Configuration and What It Means
Since the beginning of July, XRP has formed a cup and handle pattern on the daily chart. The cut represents a gradual resumption of selling pressure, while the handle reflects a consolidation phase since July 21.
The bullish outlook remains supported by declining sales volume as prices fall, indicating a pause rather than a new wave of sales. Key resistance lies at $1.15, aligning with the 0.618 Fibonacci retracement level.
A daily close above this figure would break the handle and activate the cup neckline at $1.16, with $1.18 and $1.21 as potential targets for XRP Ripple.
However, it is important to note that XRP has failed to sustain cup formations previously. A single candle wick over $1.15 is insufficient; a confirmed daily close is necessary for a convincing breakout.
$XRP
Say what you want, but this whole setup seems insane!
Sweep the stockings or not…
A major movement is coming. pic.twitter.com/MJFD9UJNzh
— Jim Knox (@Jim_Knox589) July 23, 2026
ETF inflows: green on the surface, fading below
In other XRP news, ETF inflows have consistently been net positive since launch, although monthly totals have declined. According to CoinGlass, inflows totaled $81.59 million in April, peaked at $131.94 million in May, then dropped to $59.46 million in June and declined further to $12.43 million in July.
This downward trend suggests that institutional demand for XRP has weakened, as ETF inflows typically indicate interest from professional buyers, making it a crucial data point to watch in the coming weeks.
A drop in these flows could affect the price of XRP, especially as it approaches a breakout point. Similar patterns of reduced institutional demand are also seen in Bitcoin ETF products.
(SOURCE: CoinGlass)
What Glassnode’s Hodler Metric Reports
Glassnode’s Hodler Net Position Change metric tracks whether long-term XRP holders are significantly increasing or reducing their positions. It is an on-chain measure of accumulation or distribution behavior among portfolios held for long periods, the cohort least likely to be driven by short-term noise.
The metric’s recent history is worth tracing carefully, as it has already executed this playbook once. On June 22, the Hodler Net Position Change reached one of its highest numbers. From this peak it declined steadily until July 1.
During this specific window, the price of XRP corrected from $1.13 to $1.05 – a 7% move that took many traders who were watching the chart pattern rather than the on-chain signal offside. Then, as long-term holders started adding again, the price recovered.
Since July 19, the indicator has fallen again. It increased from around 231 million to around 226 million XRP, according to Glassnode data cited in the BeInCrypto analysis. The pattern is close enough to the June precedent to merit special attention.
Trade XRP on ByBit and Join 99Bitcoin’s $1,000 USDT Airdrop
Three scenarios for what happens next: XRP news catalysts needed for bullish continuation
(SOURCE: TradingView)
The XRP News chart and institutional data indicate three potential paths for its price action:
Bull case: XRP closes above $1.15, confirming a cup-and-handle breakout. If $1.16 is breached, the $1.21 target could be reached, but this would require stable ETF inflows to maintain gains.
Base case: Le XRP se négocie latéralement entre 1,12 $ et 1,15 $ alors que le changement de position nette de Hodler diminue et que les entrées d’ETF restent faibles. The cup and handle trend remains valid but unconfirmed, awaiting a macroeconomic catalyst.
Bear case: A sharper decline in the Hodler settings results in a decline below $1.13, exposing support levels at $1.12 and $1.09. A break below $1.05 invalidates the trend and shifts attention to broader support. This scenario aligns with current ETF flow trends.
EXPLORE: Best Crypto Presales with Asymmetric Upside Potential in Today’s Market
The article XRP aims for $1.21 but institutional demand quietly dries up appeared first on 99Bitcoins.


