


zkSync is showing clear signs that bull money is returning to the market, as the “zero knowledge” theme it relies on – as well as its ties to privacy-focused crypto – continues to gain traction, even in Google Search.
The asset jumped 11% over the past day, and this move continues to gain momentum. Community investors are betting that zkSync will continue its rise, with 75% of the 53,700 traders surveyed positioned bullishly.
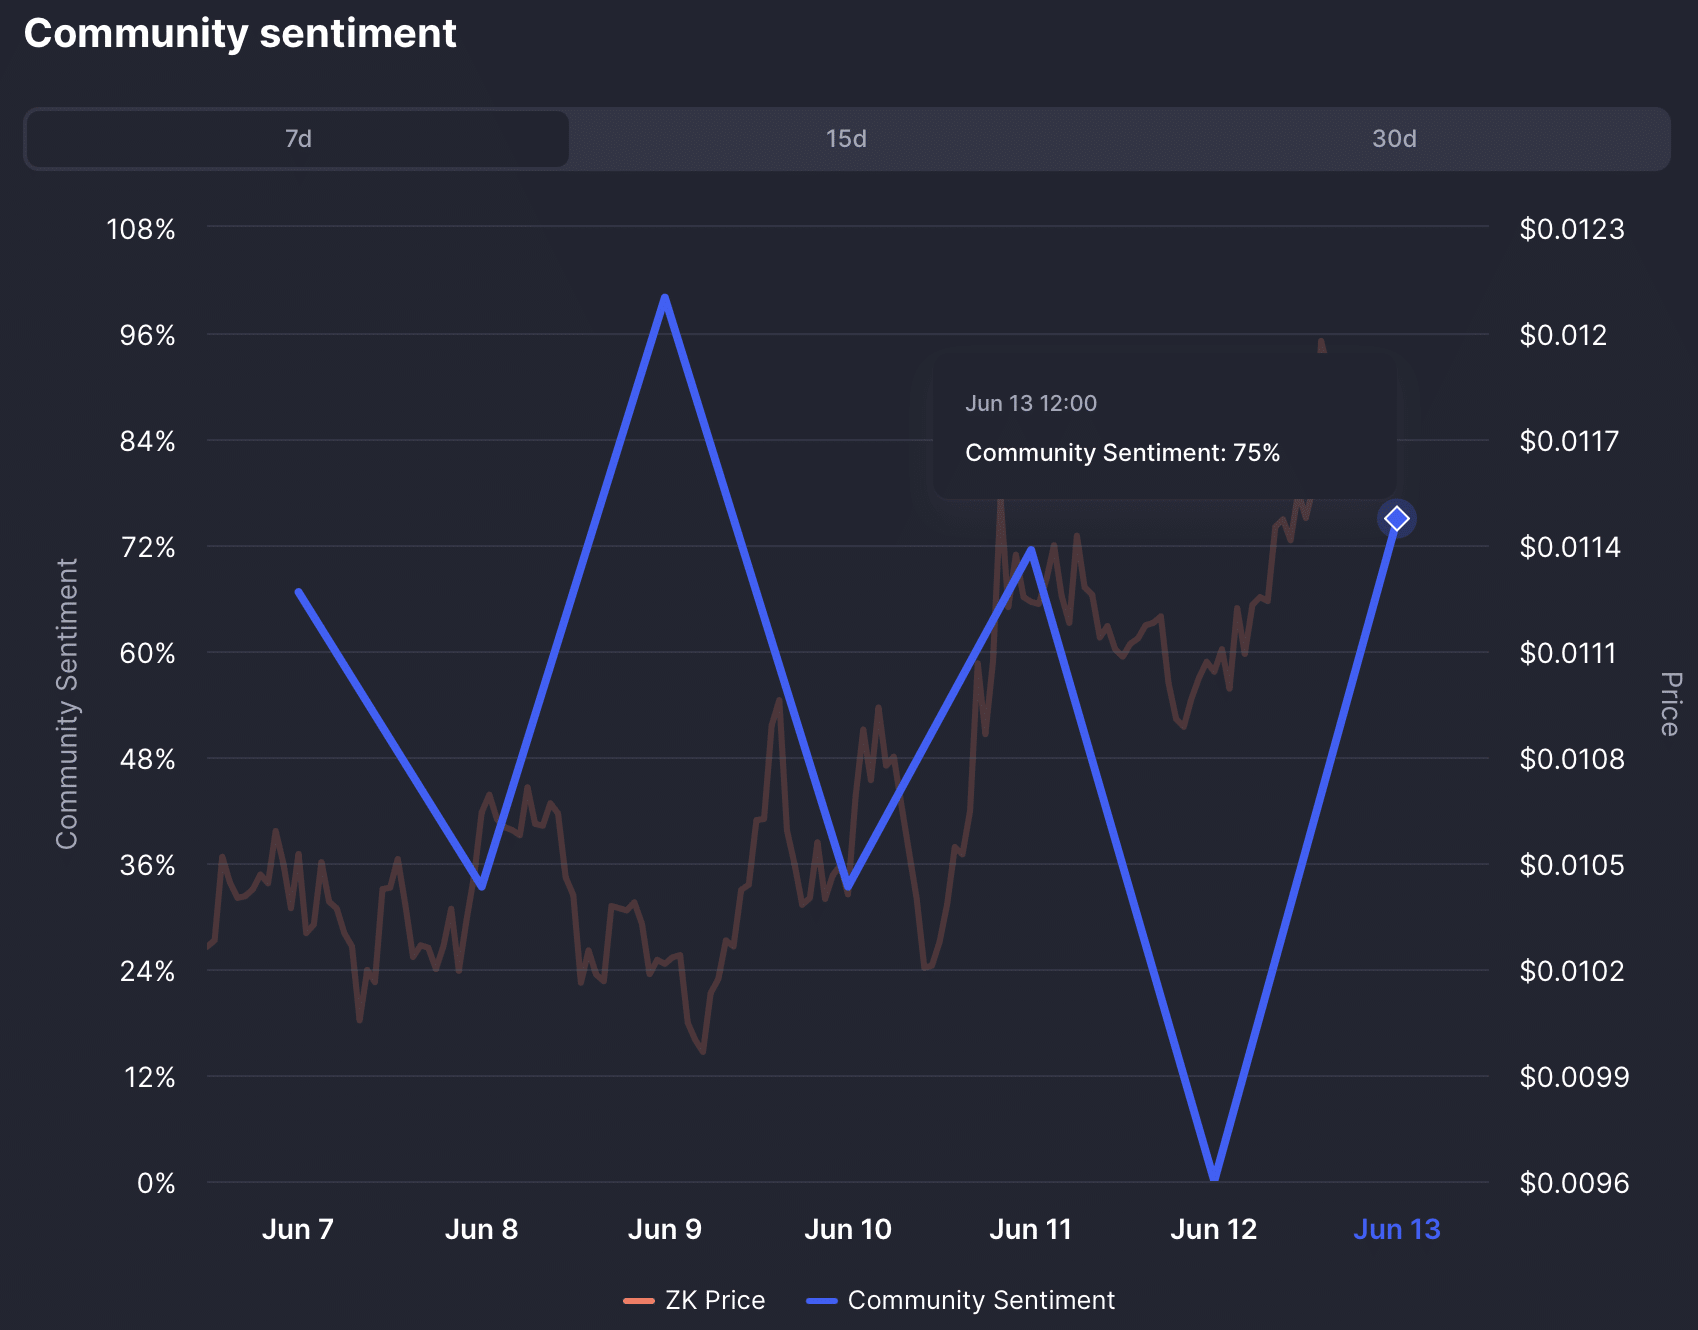
Although this development appears bullish on the surface, the structure tells a different story. zkSync is likely to face a significant decline in its next phase as the chart structure remains bearish and indicators are flashing warning signs.
zkSync graph structure points lower
Two key structures explain why zkSync appears bearish. First, the asset trades inside an ascending channel defined by parallel support and resistance lines. Second, price pushed into a block of supply orders, marked by the blue box on the chart.
An ascending channel appears bullish because the price continues to rise, but it often forms just before a significant decline, a decline that tends to bring the price back toward where the channel started.
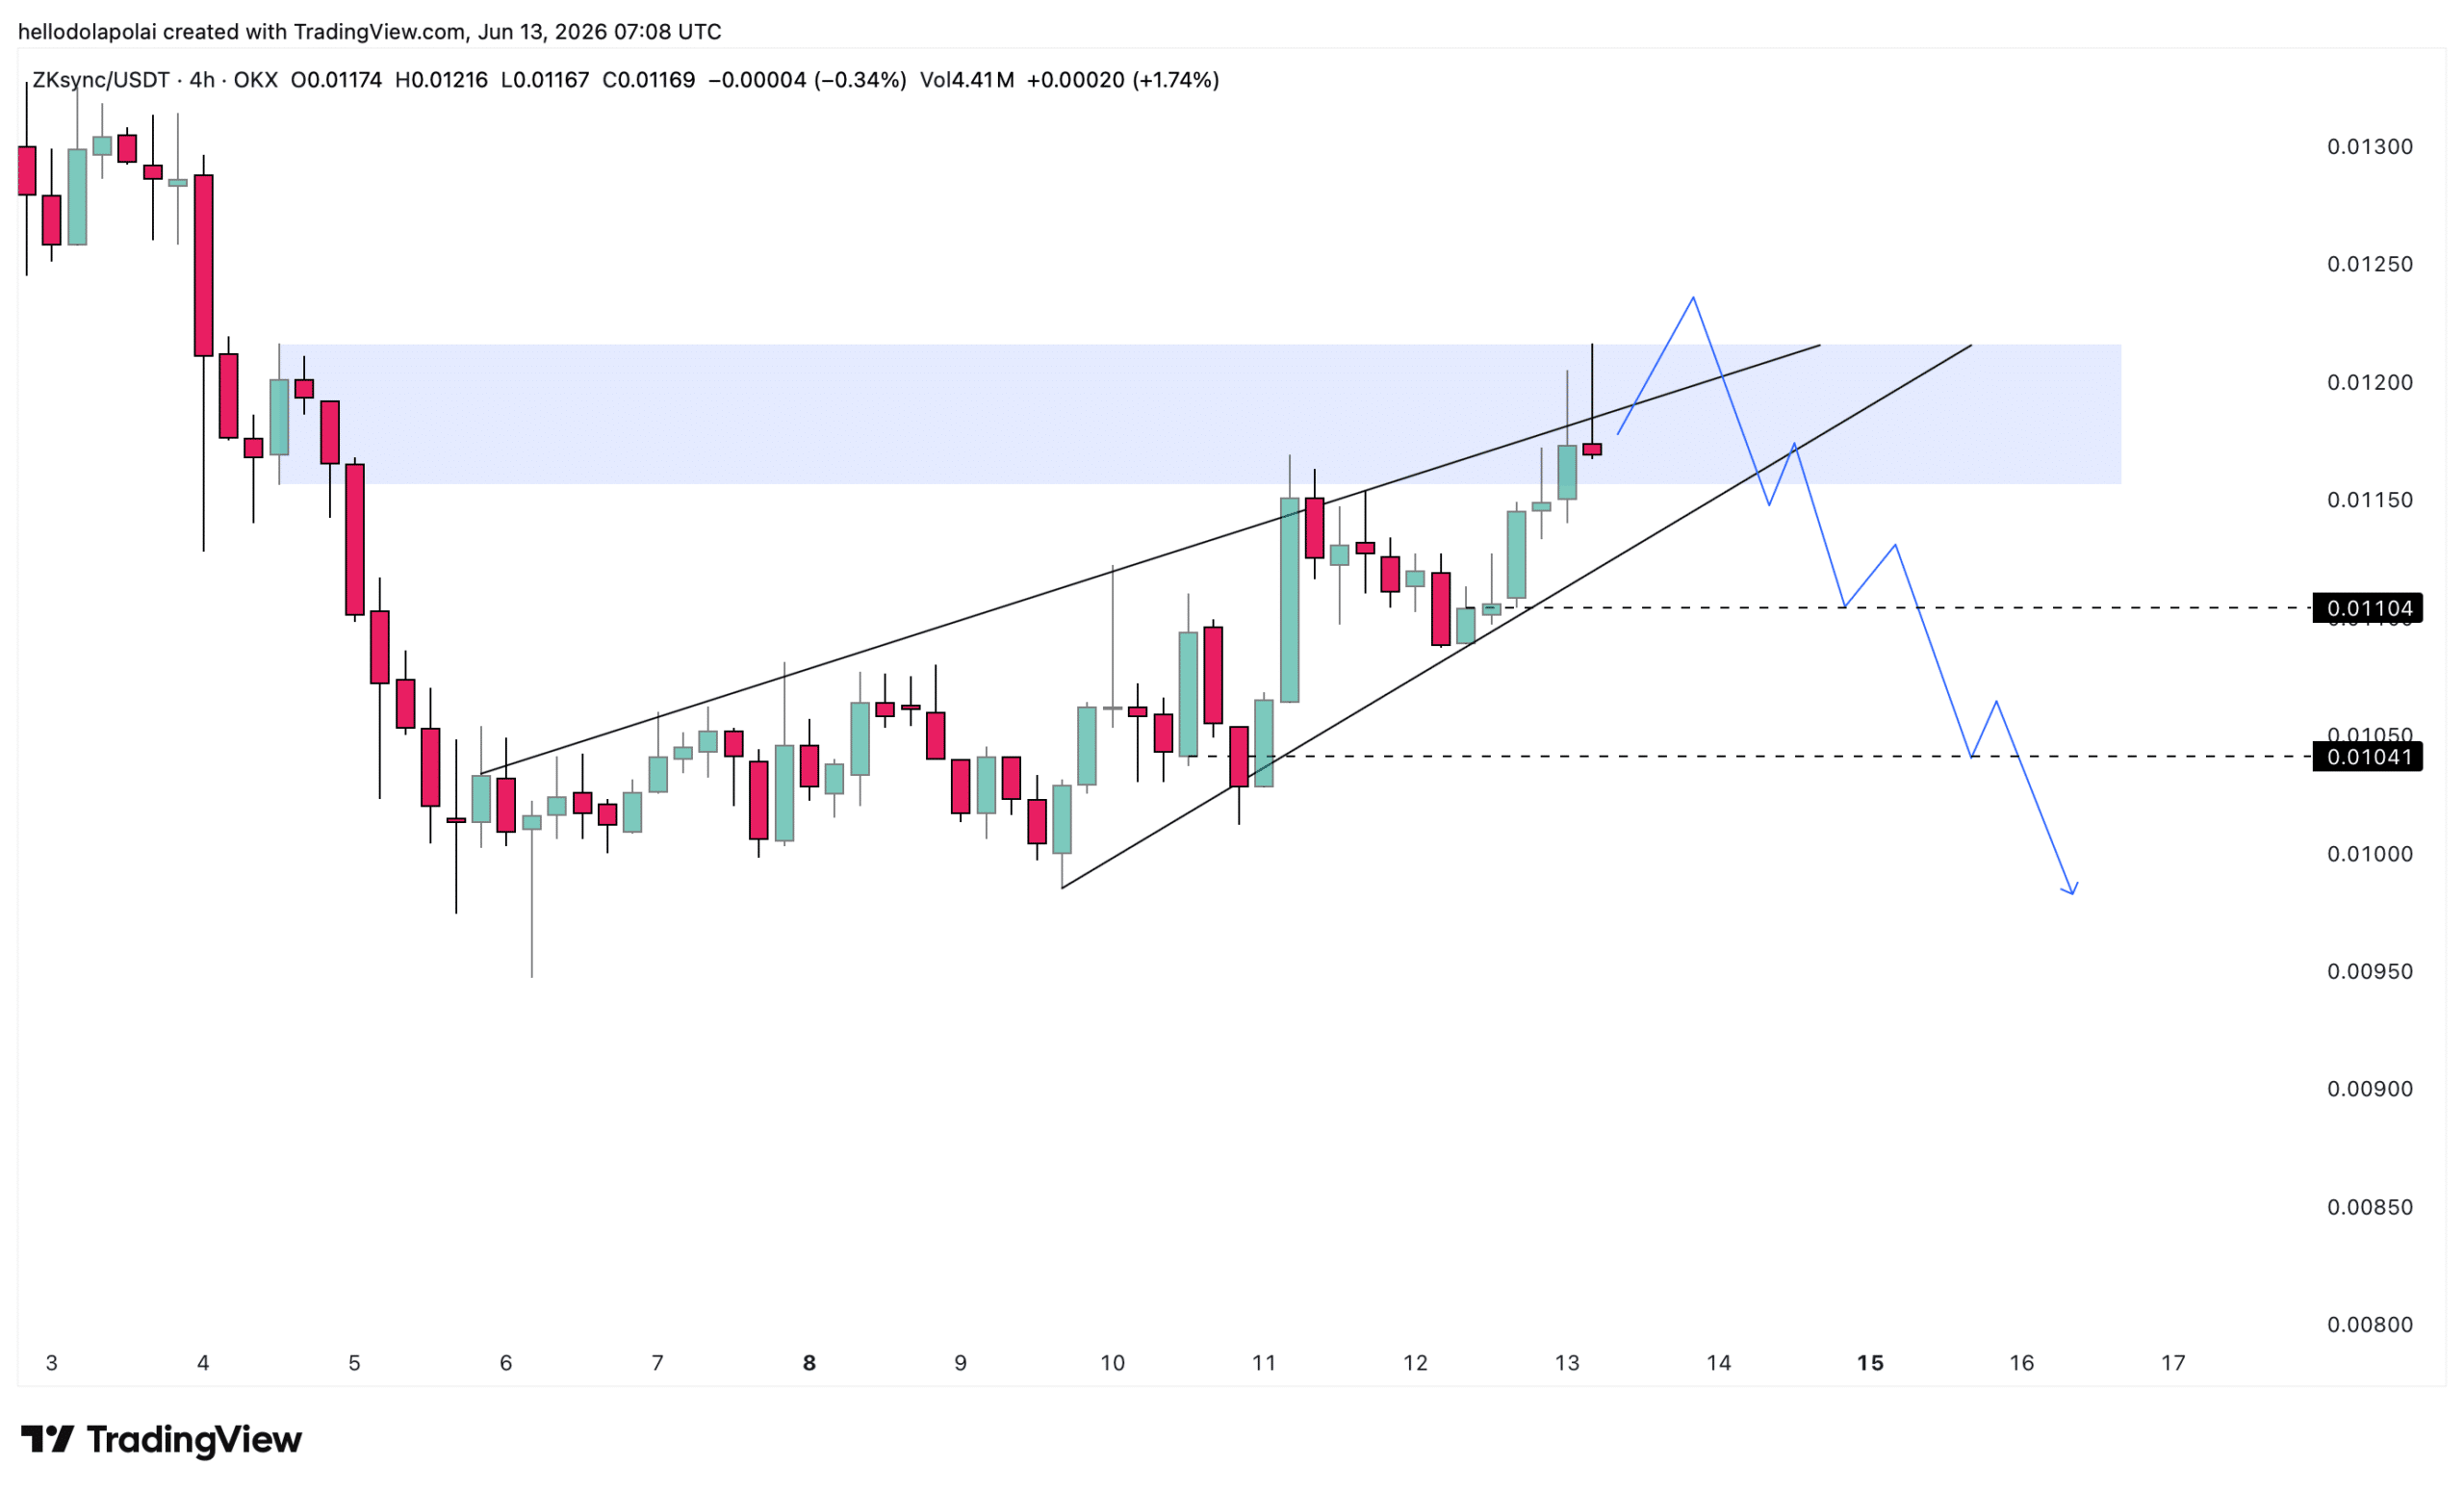
Trading within this channel has now carried zkSync directly into the supply order block highlighted in blue. A supply zone marks the area where sell orders are concentrated and often triggers a decline.
When these two signals align, they increase the chances that the market will experience a sharp decline and eliminate “overly bullish capital from the market.”
Indicators show zkSync trading pays off
Indicators confirm that zkSync is overvalued. Bollinger Bands, a tool that assesses whether price is stretched from its recent range, now places zkSync in the overvalued zone.
This area shows that zkSync is trading at a price higher than its current value. Historically, every time the asset entered this territory, buyers would eventually run out and prices would soar, although there is no fixed timetable for when this turning point will arrive.
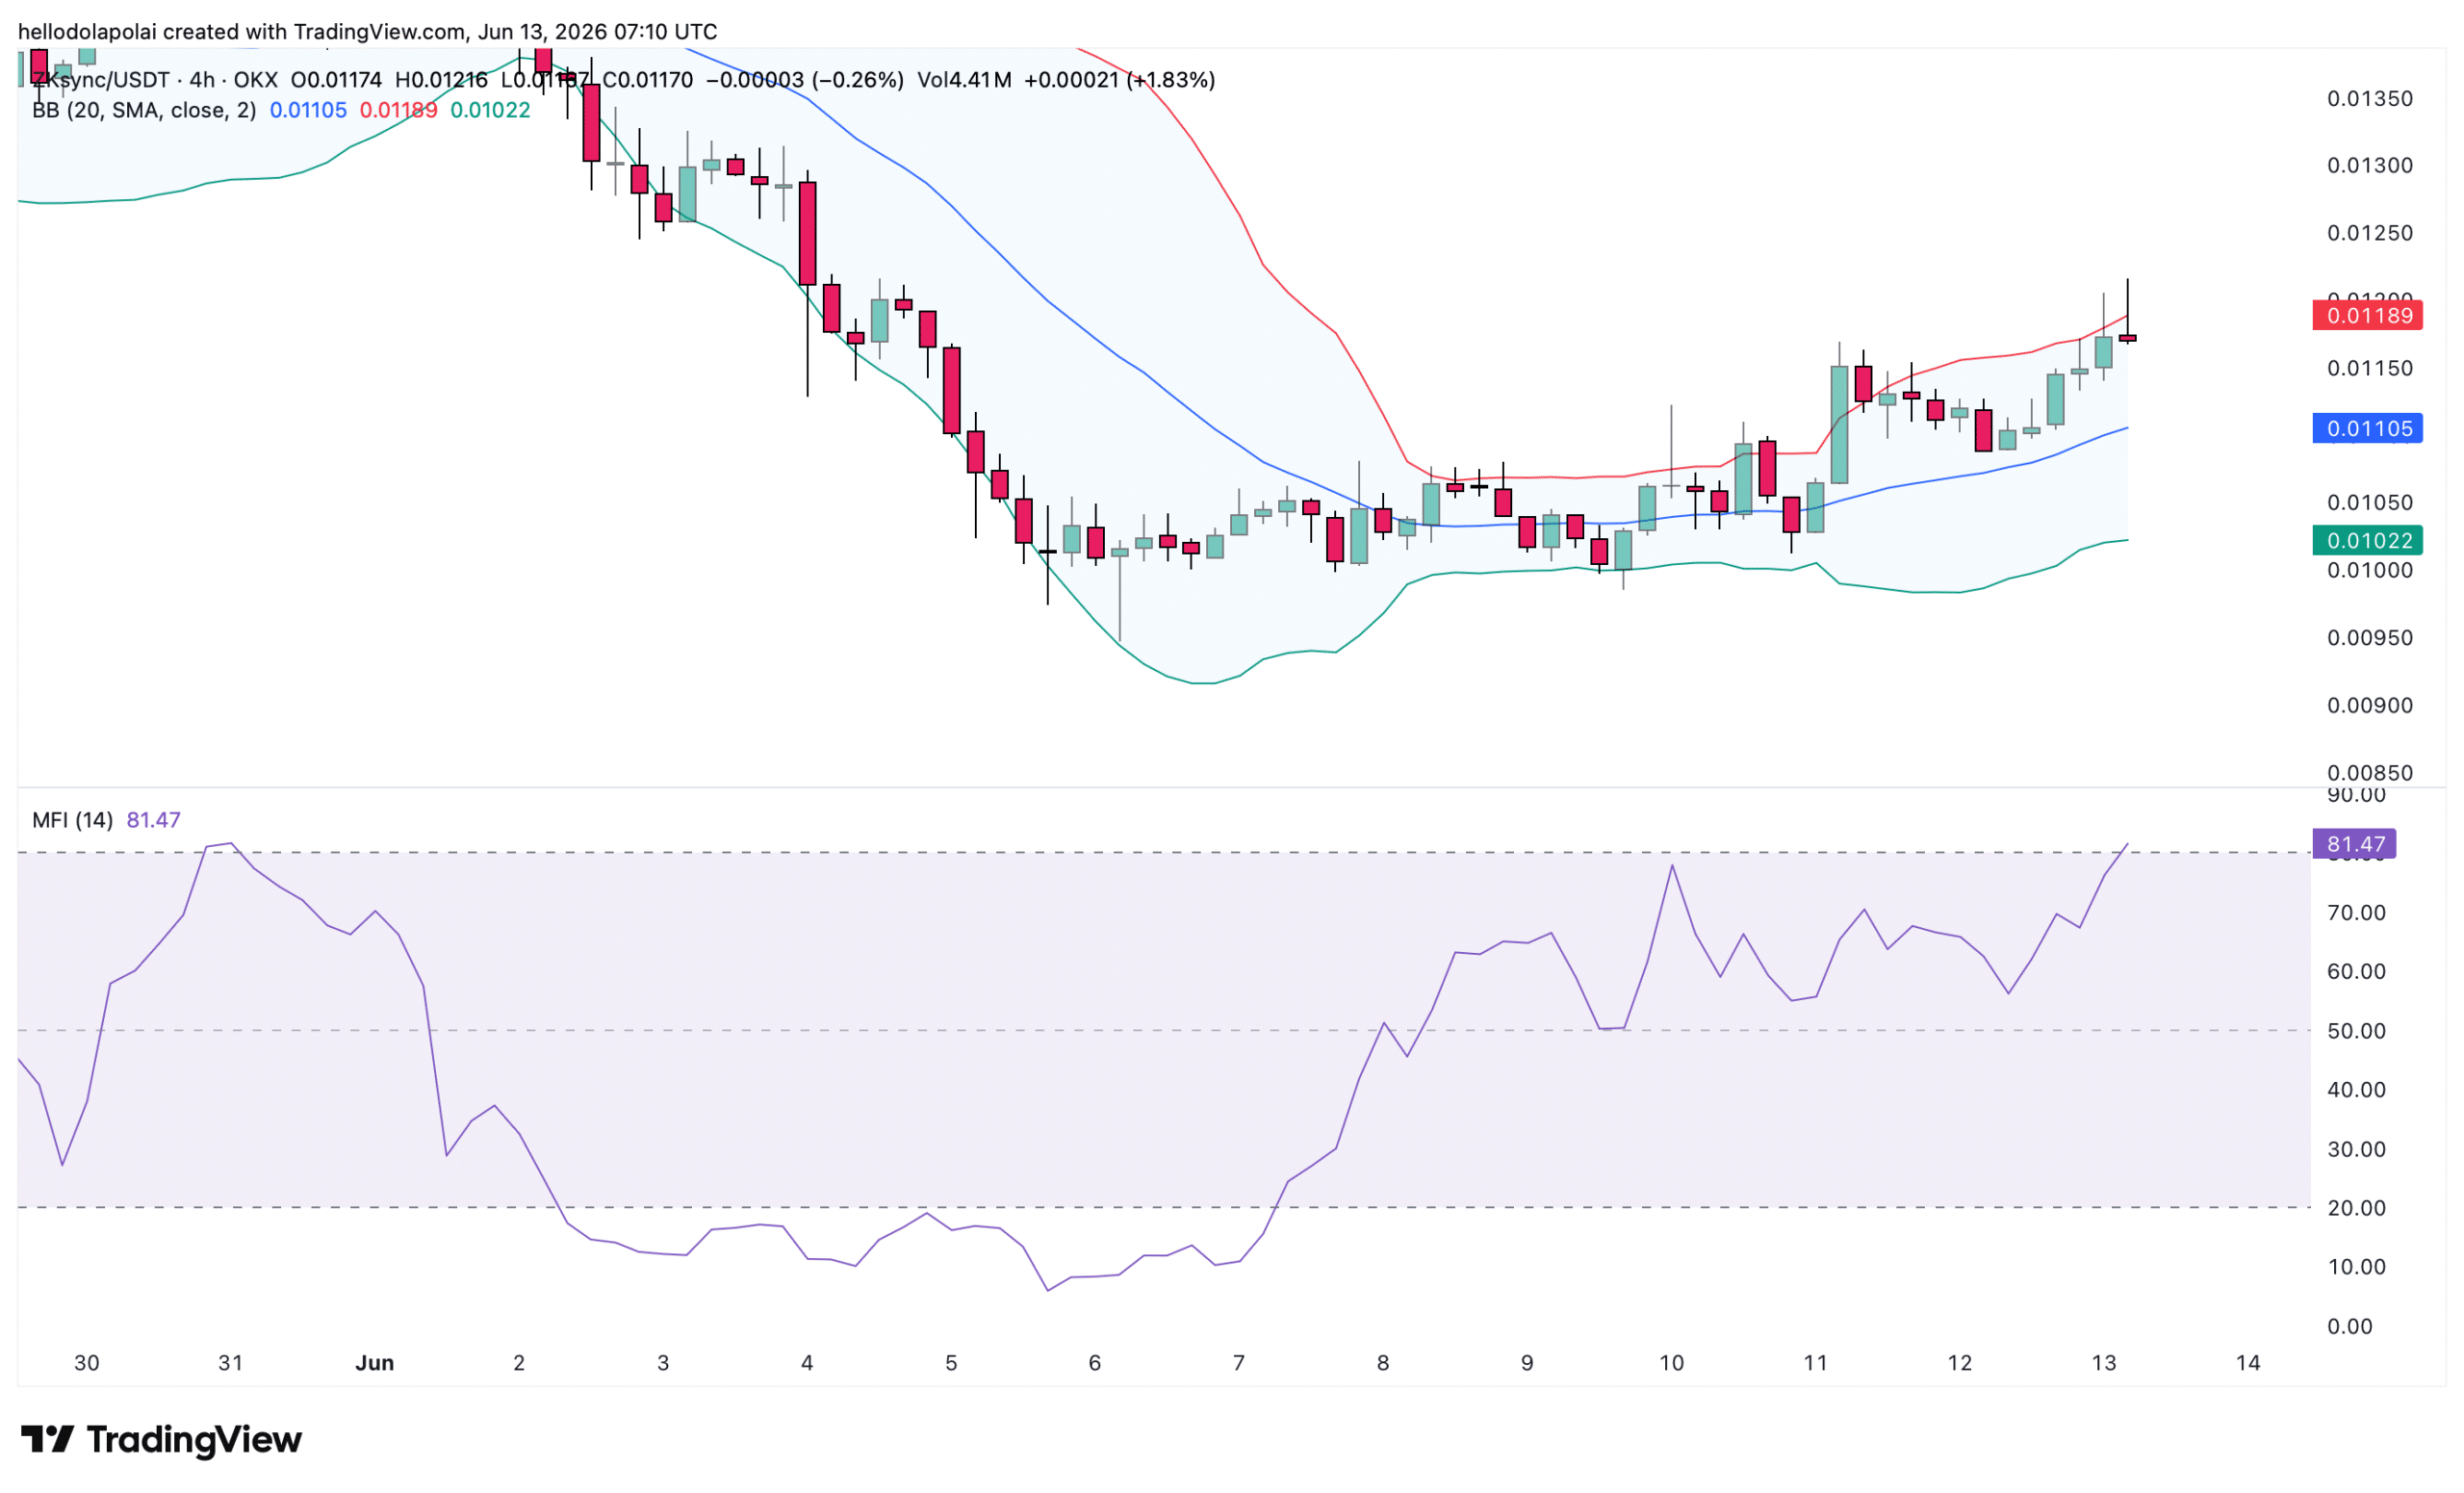
Capital has also entered a phase where buyers are becoming greedy and paying more than they should, betting that zkSync will maintain the upward momentum that the market has built.
The Money Flow Index tracks this and has now risen above 80 – another sign that the asset is deep in overvalued territory and that buying pressure will ease as the market resets.
The scope of the withdrawal is important here. A move below 50 would signal that the bears have taken full control, while a reading between 50 and 80 could simply mark a bounce to one of the levels indicated by the dotted lines on the chart.
Forward flows remain favorable
zkSync futures flows remained decent, supporting a continued upward trend and further gains for the asset.
At the time of writing, the average funding rate had turned positive at around 0.0109%, meaning most traders are channeling their capital into long positions in the perpetual market as they prepare for a rally.
However, given the structure, these long-biased traders are likely speculating too much – and this overcrowding could lead to a significant round of liquidations.
Final summary
- zkSync is up 11%, and most traders are betting it continues to climb, but the chart is quietly showing warning signs.
- The price now appears stretched and overbought, so a pullback could erase some of the recent gains before any further upside.