Close Menu
Altcoin ObserverAltcoin Observer
  • Regulation
  • Bitcoin
  • Altcoins
  • Market
  • Analysis
  • DeFi
  • Security
  • Ethereum
Categories
  • Altcoins (3,619)
  • Analysis (3,721)
  • Bitcoin (4,349)
  • Blockchain (2,157)
  • DeFi (2,623)
  • Ethereum (2,760)
  • Event (119)
  • Exclusive Deep Dive (1)
  • Landscape Ads (2)
  • Market (2,714)
  • Press Releases (12)
  • Reddit (2,847)
  • Regulation (2,474)
  • Security (4,008)
  • Thought Leadership (3)
  • Videos (44)
Hand picked
  • Why VELVET’s 12% Drop Could Be the Start of a Bullish Pattern
  • Strategy Still Dominates Corporate Bitcoin, But Treasury Premiums Under Pressure
  • Trump’s Crypto Profits Hit $1 Billion As Bitcoin Falls 50% From Its ATH
  • LAB’s Fate Depends on $6 Support After 32% Crash – Break It and…
  • Canary HBAR ETF sees biggest inflow since May as Hedera remains focused
We are social
  • Facebook
  • Twitter
  • Instagram
  • YouTube
Facebook X (Twitter) Instagram
  • About us
  • Disclaimer
  • Terms of service
  • Privacy policy
  • Contact us
Facebook X (Twitter) Instagram YouTube LinkedIn
Altcoin ObserverAltcoin Observer
  • Regulation
  • Bitcoin
  • Altcoins
  • Market
  • Analysis
  • DeFi
  • Security
  • Ethereum
Events
Altcoin ObserverAltcoin Observer
Home»Altcoins»Why VELVET’s 12% Drop Could Be the Start of a Bullish Pattern
Altcoins

Why VELVET’s 12% Drop Could Be the Start of a Bullish Pattern

July 5, 2026No Comments
Share Facebook Twitter Pinterest LinkedIn Tumblr Reddit Telegram Email
Share
Facebook Twitter LinkedIn Pinterest Email


Velvet (VELVET) has fallen 12% over the past day at press time as increasing seller pressure forced the token lower. This decline has drained capital from the market. In the perpetual futures market, traders withdrew $8.76 million, with approximately $688,940 tied to liquidated positions.

What comes next may not be the new twist many expect. Rather, the fractal patterns indicate about two more weeks of consolidation before VELVET stages a significant rally or stronger decline.

VELVET Decline Echoes June Fractal

Chart analysis shows that VELVET’s recent decline reflects a trend that first formed between June 10 and 12, when the price oscillated sharply in both directions before settling into a 13-day consolidation.

A similar pattern preceded the last move, a rally that took place from June 26 to July 2, after which the price entered a three-day consolidation period that currently continues.

VELVET price table. VELVET price table.
Source: TradingView

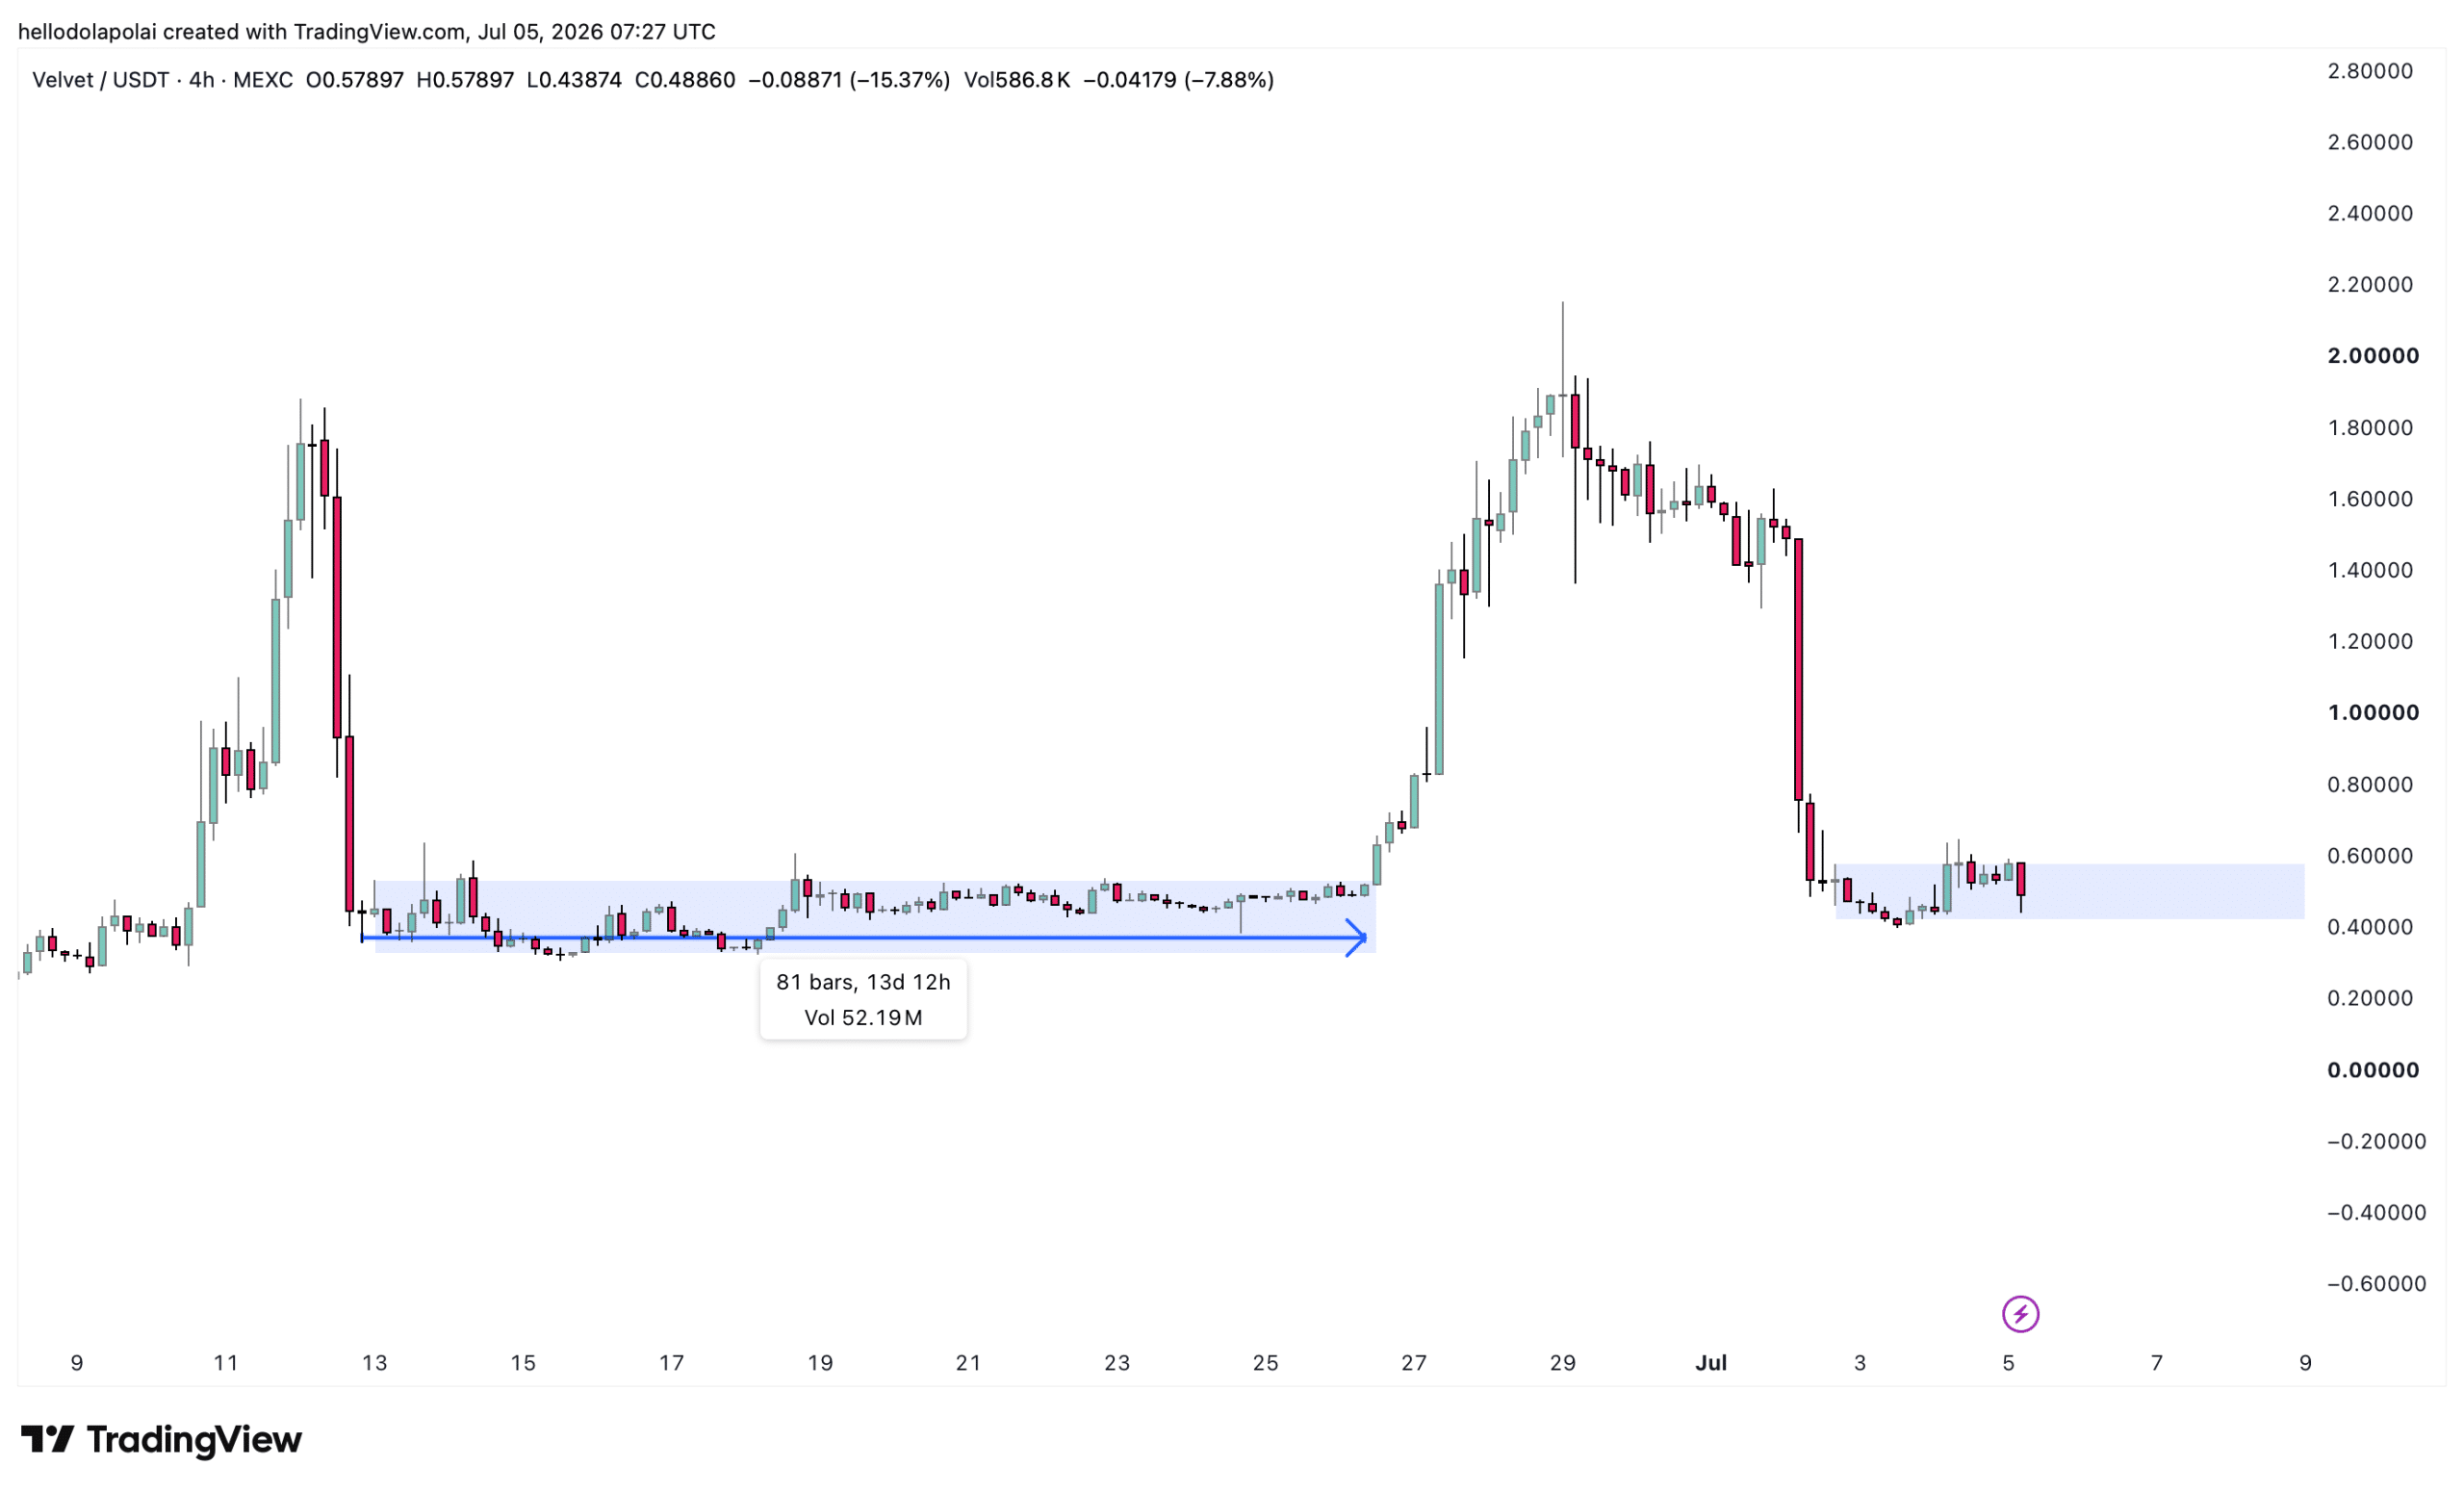
If the trend repeats, VELVET could continue trading inside this channel for another 11 days, a period of approximately two weeks that would pass without notable gains or losses.

Two levels frame this outlook, resistance at $0.577 above and support at $0.417 below. A decisive close above $0.577 would make the token bullish, while a close below $0.417 would see it swing lower.

Indicators lean price towards a bullish breakout

The setup still leaves room for an extended range, although traders are leaning slightly toward an uptrend given VELVET’s current positioning.

At the time of analysis, the blue line following the Aroon Down continued to slide, while the orange line marking the Aroon Up was steadily rising.

VELVET technical indicators table. VELVET technical indicators table.
Source: TradingView

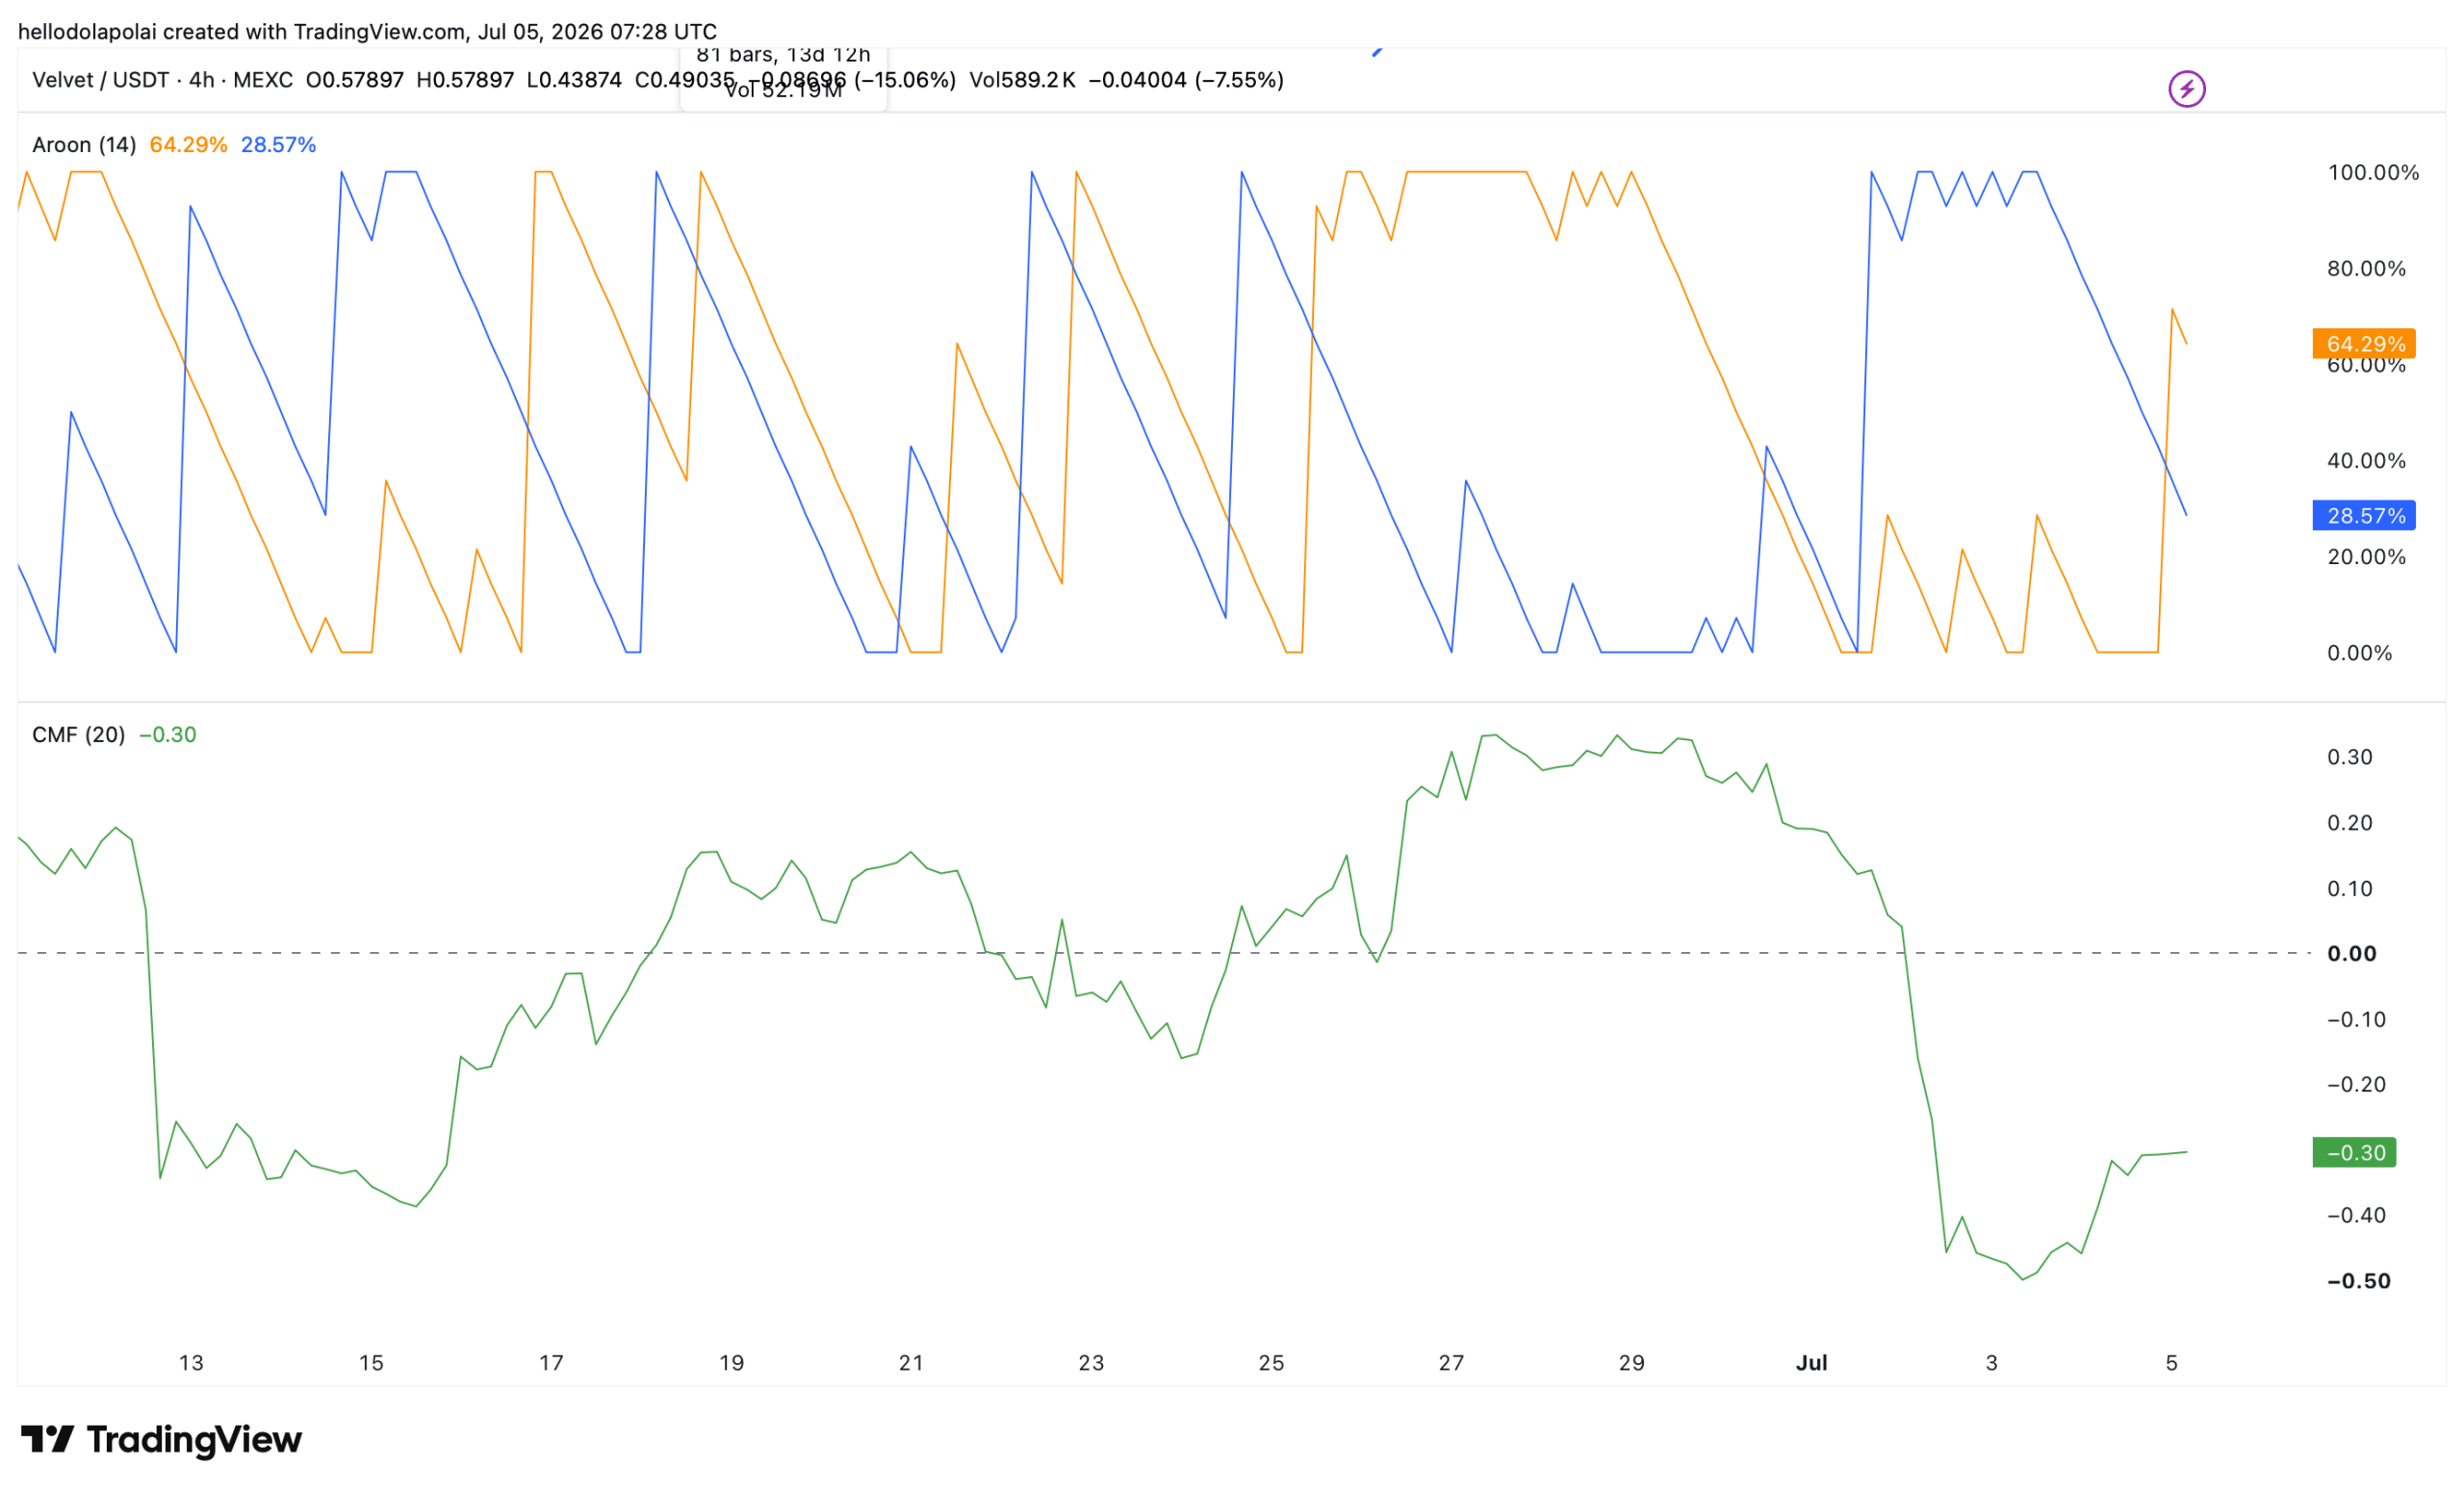
If both lines maintain their current trajectory, a bullish breakout becomes the most likely outcome. If they flatten out and move sideways, VELVET will likely remain limited in range.

Trading volume reinforced the trend, moving more toward a prolonged uptrend than consolidation or further decline.

Trader sentiment remains firm

Interest in VELVET within the trading community remains high.

Currently, 74% of traders are voting bullish, down from the previous day’s peak of 88%. Although the majority remains firmly optimistic, the decline signals a cooling of conviction.

New traders have also entered as true holders rather than short-term speculators. The token holder’s account on CoinMarketCap hit a new high over the past day, even as VELVET printed a new low price.


Final summary

  • VELVET fell 12% as sellers took control, draining $8.76 million from the perpetual futures market in a single day.
  • Fractal patterns indicate about two more weeks of consolidation, and with most traders still bullish and holders’ numbers at a new high, the decline looks more like a pause than a reversal.


Source link

Share. Facebook Twitter Pinterest LinkedIn Tumblr Email
Previous ArticleStrategy Still Dominates Corporate Bitcoin, But Treasury Premiums Under Pressure

Related Posts

Altcoins

LAB’s Fate Depends on $6 Support After 32% Crash – Break It and…

July 5, 2026
Altcoins

Airfield Financing: Can AERO aim for $0.65 after 22% weekly rally?

July 5, 2026
Altcoins

Here’s why Sonic’s price rebound might be shakier than it seems

July 5, 2026
Add A Comment
Leave A Reply Cancel Reply

Single Page Post
Share
  • Facebook
  • Twitter
  • Instagram
  • YouTube
Featured Content
Event

Dutch Blockchain Week 2026 strengthens position as Europe’s leading B2B blockchain event week

April 14, 2026

Amsterdam, April 2026 – Dutch Blockchain Week 2026 is rapidly evolving into one of Europe’s…

Event

Global Games Show Riyadh: The Ultimate Creator & Influencer Hub

March 31, 2026

The fast-evolving gaming ecosystem of Riyadh is powered by solid national investment, a flourishing esports…

1 2 3 … 82 Next
  • Facebook
  • Twitter
  • Instagram
  • YouTube

Why VELVET’s 12% Drop Could Be the Start of a Bullish Pattern

July 5, 2026

LAB’s Fate Depends on $6 Support After 32% Crash – Break It and…

July 5, 2026

Airfield Financing: Can AERO aim for $0.65 after 22% weekly rally?

July 5, 2026
Facebook X (Twitter) Instagram LinkedIn
  • About us
  • Disclaimer
  • Terms of service
  • Privacy policy
  • Contact us
© 2026 Altcoin Observer. all rights reserved by Tech Team.

Type above and press Enter to search. Press Esc to cancel.

bitcoin
Bitcoin (BTC) $ 62,761.00
ethereum
Ethereum (ETH) $ 1,779.99
tether
Tether (USDT) $ 0.999101
bnb
BNB (BNB) $ 589.73
usd-coin
USDC (USDC) $ 0.999761
xrp
XRP (XRP) $ 1.14
solana
Solana (SOL) $ 81.03
tron
TRON (TRX) $ 0.328066
figure-heloc
Figure Heloc (FIGR_HELOC) $ 1.01
staked-ether
Lido Staked Ether (STETH) $ 2,265.05