


Akash Network (AKT) remained under pressure over the past session as sellers tightened their grip on the market. At the time of going to press, tThe token fell by 14.14% in the last 24 hours and is trading near $0.744. Despite this decline, commercial activity has accelerated significantly.
Daily volume soared 70.31% to $18.85 million, showing that participants increased their activity during the sale rather than moving away from the market. This combination of increasing volume and falling prices often reflects stronger conviction on the part of sellers.
As a result, the latest decline appears to be due to active distribution rather than a lack of interest.
Why are AKT traders still optimistic?
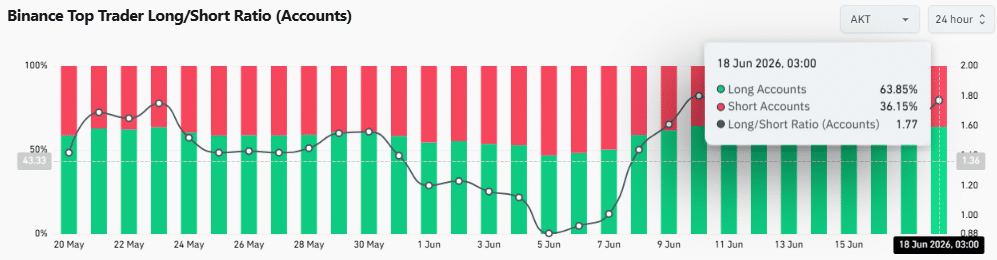
Binance trader sentiment painted a very different picture of price action. CoinGlass analytics showed that 63.85% of accounts remained long, while only 36.15% held short positions. This pushed the Long/Short ratio to 1.77, highlighting a clear bullish bias despite the ongoing correction.
The positioning trend has strengthened in recent days as the ratio has climbed from lower levels recorded earlier in June. Traders continued to increase their bullish exposure even as AKT extended its losses.
The continued long-term dominance showed that traders had not abandoned their expectations of a broader recovery despite the recent weakness.
AKT approaches a decisive technical zone
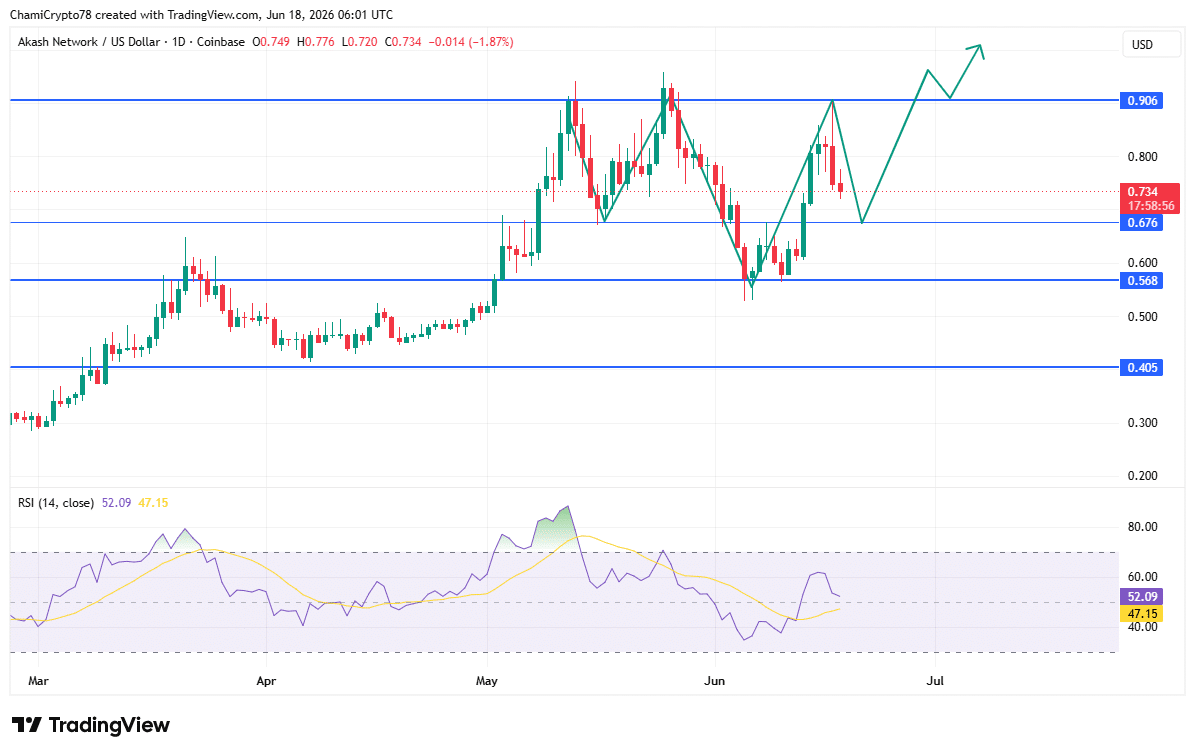
The price structure remained constructive on the daily chart despite the recent correction.
AKT continued to hold above the key support level of $0.676, an area that previously triggered a strong rebound towards higher resistance. Below this area, the next major support was near $0.568. As long as buyers defended these levels, the broader structure of the rally remained intact.
The chart also highlighted a major resistance barrier near $0.906. Recent attempts to contest this area have failed, contributing to the latest setback. At the time of writing, The RSI reflected a neutral outlook rather than outright weakness. The indicator stood at 52.09 while its signal line remained near 47.15.
Earlier in June, the RSI recovered from oversold territory and rose above its moving average, indicating improving market strength. Although the RSI eased slightly during the correction, it continued to hold above the midpoint.
If buyers regain control near support, AKT could attempt another move towards the $0.906 resistance zone.
AKT Liquidity Concentration Above $0.90 Draws Attention
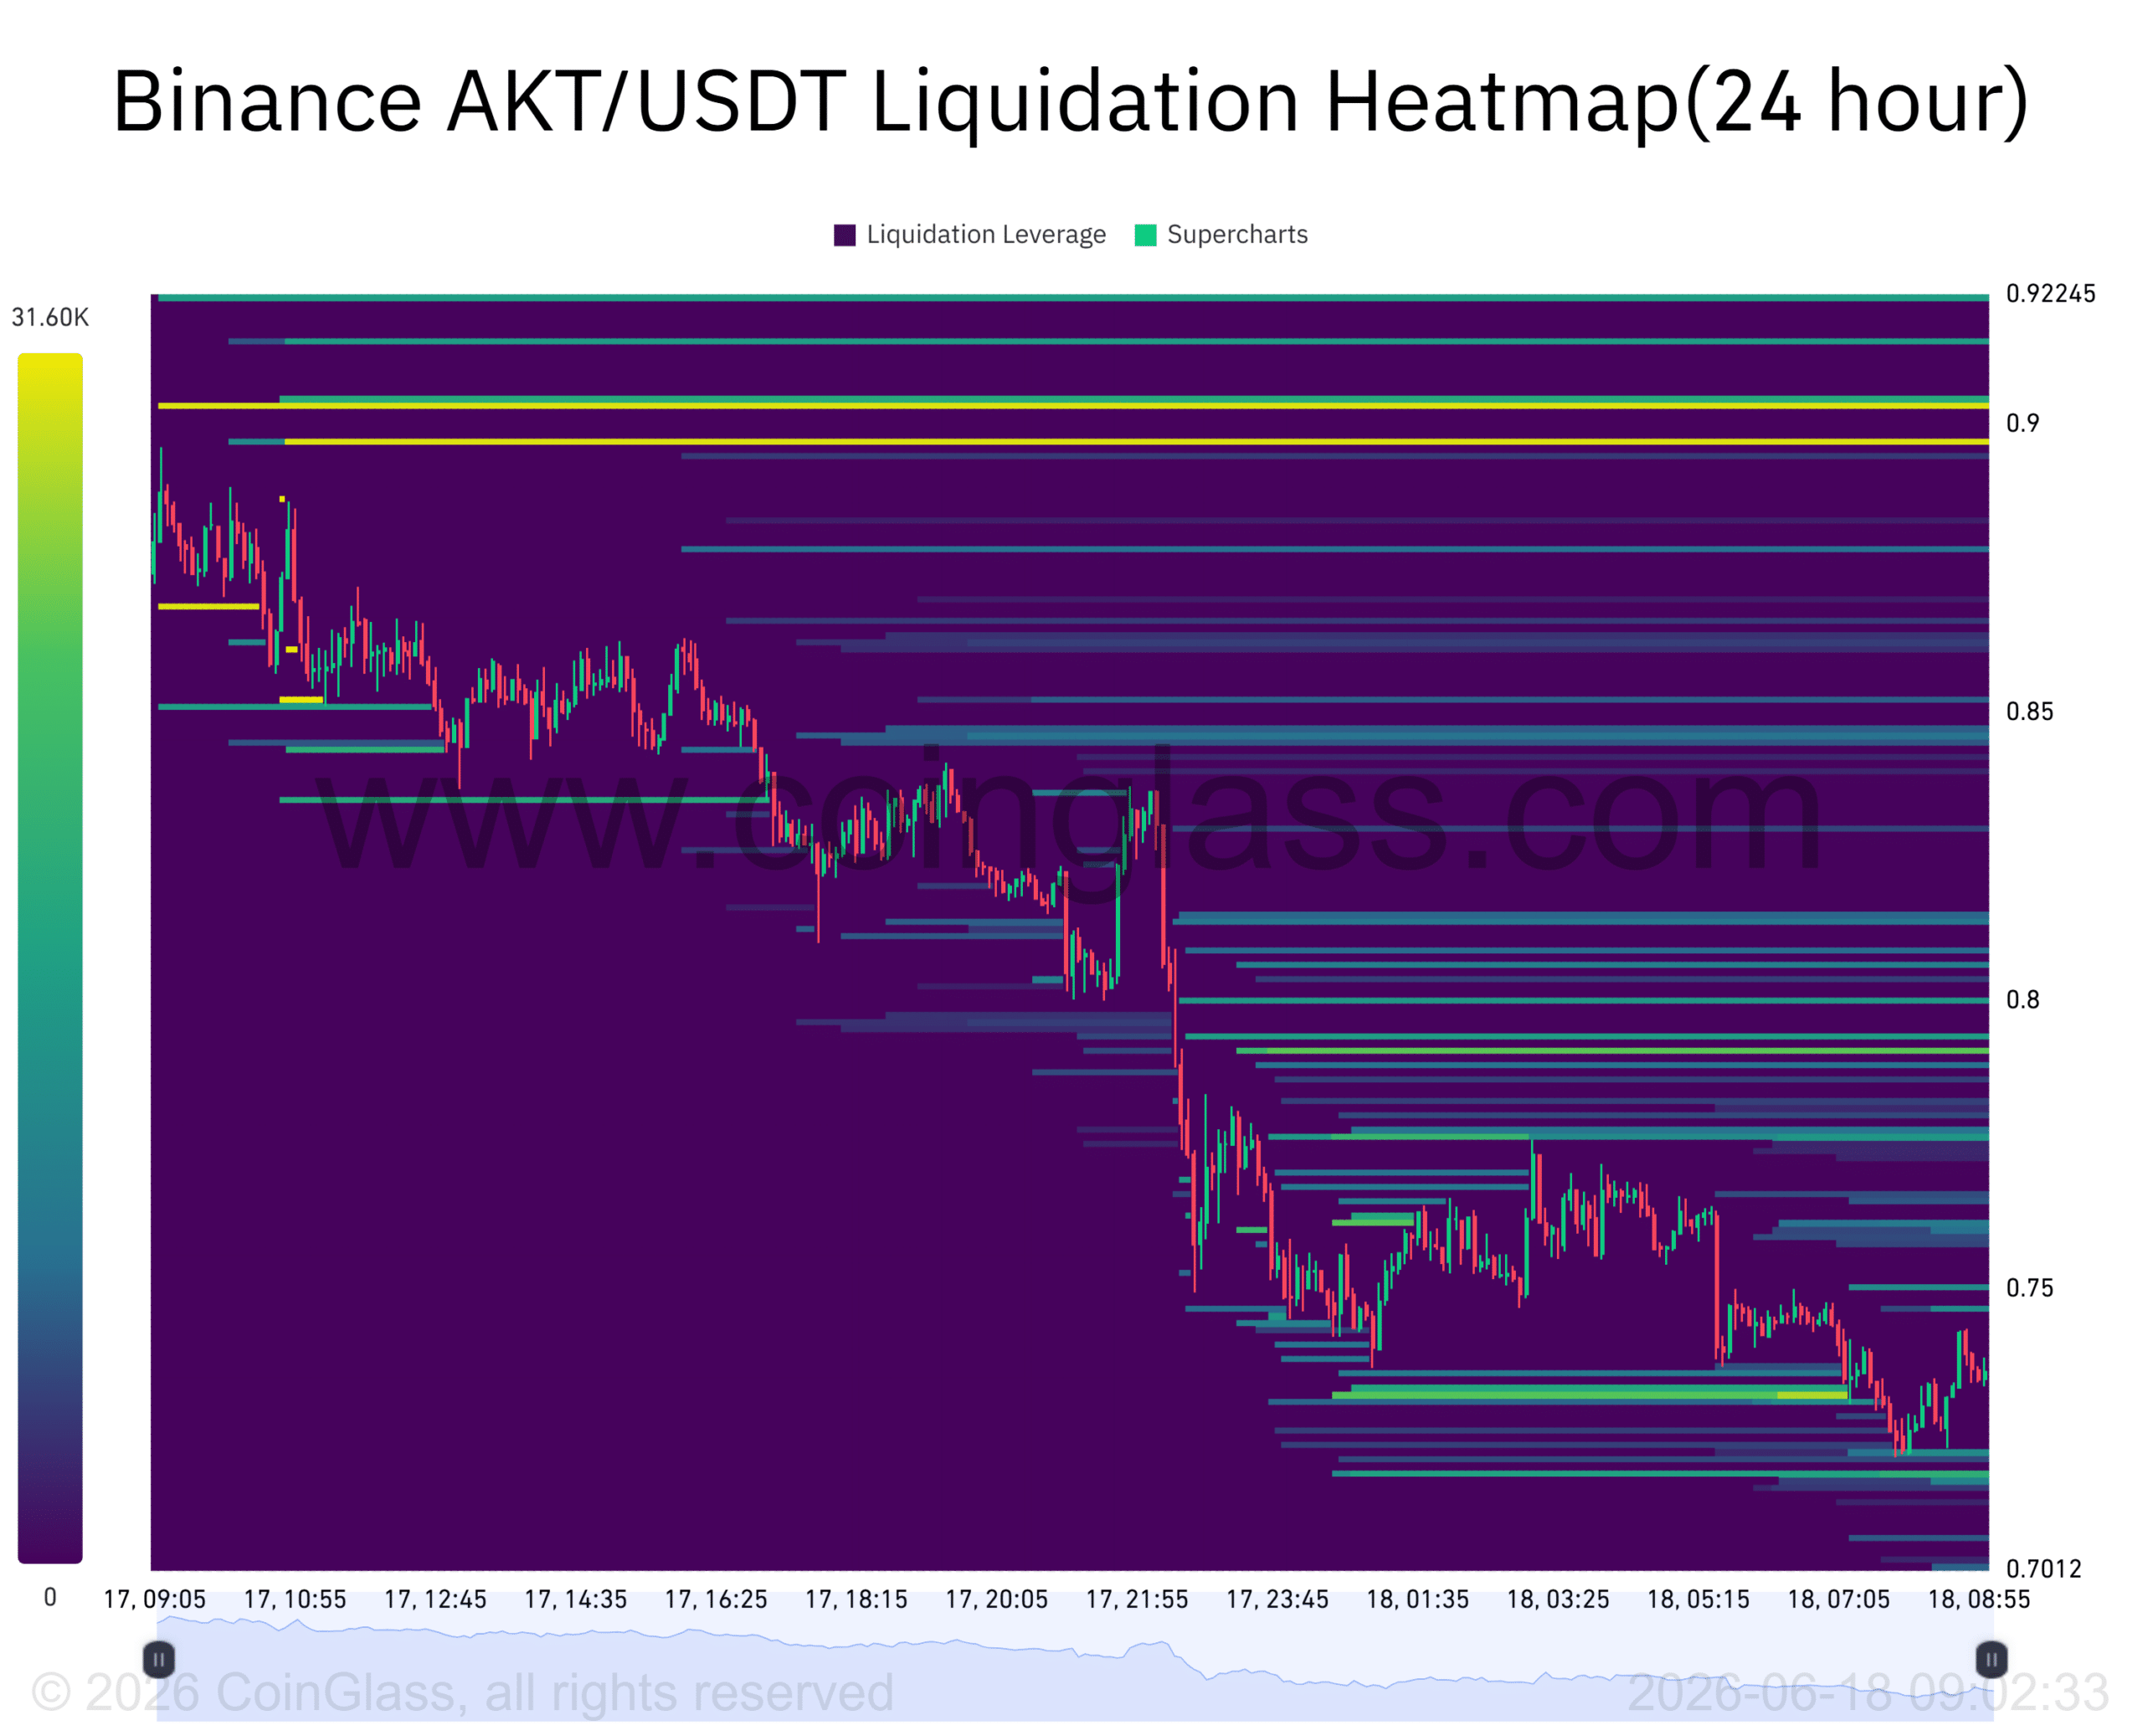
The liquidation heatmap revealed a notable concentration of liquidity above current prices. Several of the largest liquidation clusters were between $0.90 and $0.92, with the strongest concentration near $0.906.
Markets have often gravitated towards these liquidity zones because leveraged positions have accumulated around these levels. Current price action has remained significantly below this group following the recent decline towards the $0.74 region.
However, the presence of ample liquidity suggests that a recovery could drive prices towards these levels if buying pressure builds. Tighter pockets of liquidity also emerged between $0.79 and $0.85, creating intermediate targets ahead of any testing of the broader resistance zone.
On the other hand, liquidity remained relatively light below current levels.
Final summary
- Binance traders remained strongly long despite the Akash network extending its recent decline.
- Key support remained firm while major liquidity clustered near overhead resistance.