Close Menu
Altcoin ObserverAltcoin Observer
  • Regulation
  • Bitcoin
  • Altcoins
  • Market
  • Analysis
  • DeFi
  • Security
  • Ethereum
Categories
  • Altcoins (3,167)
  • Analysis (3,291)
  • Bitcoin (3,906)
  • Blockchain (2,157)
  • DeFi (2,623)
  • Ethereum (2,615)
  • Event (119)
  • Exclusive Deep Dive (1)
  • Landscape Ads (2)
  • Market (2,714)
  • Press Releases (12)
  • Reddit (2,598)
  • Regulation (2,474)
  • Security (3,678)
  • Thought Leadership (3)
  • Videos (44)
Hand picked
  • Real-World Assets in Crypto 2026: Highlights from Larry Fink’s Annual Letter
  • US-Based Bitcoin ETFs See Inflows of Around $1 Billion Last Week: Report
  • AAVE Price Falls 18% as KelpDAO Exploit Spreads – What Happened?
  • Crypto ETF Flows Increase as Bitcoin, Ethereum and XRP Attract New Capital
  • After years of “harsh” treatment Tether finally convinces ‘Big Four’ firm to audit USDT
We are social
  • Facebook
  • Twitter
  • Instagram
  • YouTube
Facebook X (Twitter) Instagram
  • About us
  • Disclaimer
  • Terms of service
  • Privacy policy
  • Contact us
Facebook X (Twitter) Instagram YouTube LinkedIn
Altcoin ObserverAltcoin Observer
  • Regulation
  • Bitcoin
  • Altcoins
  • Market
  • Analysis
  • DeFi
  • Security
  • Ethereum
Events
Altcoin ObserverAltcoin Observer
Home»Bitcoin»Bitcoin (BTC) Historical Data Signals October Bull Run Launch – Analyst
Bitcoin

Bitcoin (BTC) Historical Data Signals October Bull Run Launch – Analyst

October 5, 2024No Comments
Share Facebook Twitter Pinterest LinkedIn Tumblr Reddit Telegram Email
Dall·e 2024 10 04 06.03.04 A Dynamic Feature Image Representing A Bitcoin Bull Run. The Image Should.jpeg
Share
Facebook Twitter LinkedIn Pinterest Email


Bitcoin finds itself at a critical juncture after weeks of intense volatility, marked by enthusiasm and fear. Currently trading around $59,400, BTC is testing vital demand levels following a 10% decline from local highs around $66,000.

This recent price action has sparked uncertainty among investors, some of whom remain hopeful for new all-time highs during this cycle. Many are closely watching Bitcoin’s next moves as the crypto market reacts to external factors.

A notable crypto analyst shared a long-term chart highlighting an intriguing trend: Historically, October has often marked the start of an uptrend for BTC. This idea adds an element of optimism for those looking to capitalize on potential bullish momentum.

As the market grapples with mixed sentiment, all eyes are on Bitcoin to see if it can regain lost ground and bounce back to new highs.

The next few days will be crucial as traders evaluate whether BTC can maintain its upward trajectory or if further corrections are ahead. Given historical trends and current market dynamics, investors are eagerly waiting to see how this story plays out.

Bitcoin Halving After Halving: Is It Close?

Bitcoin is currently operating in a very volatile environment, leaving traders and investors with uncertainty. The price showed no clear signs of direction or specific target, which caused concern among market participants.

Many analysts fear that the historic uptrend expected after the recent halving may not materialize this time around, which could lead to missed opportunities for potential gains.

However, leading crypto analyst Ali offers a glimmer of hope. He recently shared compelling technical analysis on

Bitcoin Bull Run historically begins in October after the halving.
Bitcoin Bull Run historically begins in October after the halving. | Source: Ali on X BTCUSDT Monthly Chart

According to this analysis, Bitcoin has launched parabolic bull runs every October after halving events, and many believe this cycle is likely to follow suit. This historical data has caused many traders and investors to hold on to their coins, banking on the possibility of a resurgence.

This strategy could prove lucrative for some, potentially leading to substantial profits. Conversely, this could also cause problems for people who are overly optimistic, especially if BTC fails to meet these expectations.

As October progresses, the market remains in suspense. Traders know that the coming weeks will be crucial in determining the trajectory of Bitcoin.

While the potential for an uptrend looms, the risks of further volatility and corrections persist, making this a crucial time for those investing in this dynamic asset. The interplay between historical patterns and current market dynamics will soon shape the fate of BTC.

BTC tests crucial demand

Bitcoin is trading at $61,350 after facing resistance at the 4-hour 200 exponential moving average (EMA) at $61,645. Price remains above the 4-hour moving average (MA) 200 at $60,363, a crucial support level for bulls aiming to regain strength.

BTC testing the 4H 200 EMA
BTC testing the 4H 200 EMA | Source: BTCUSDT chart on TradingView

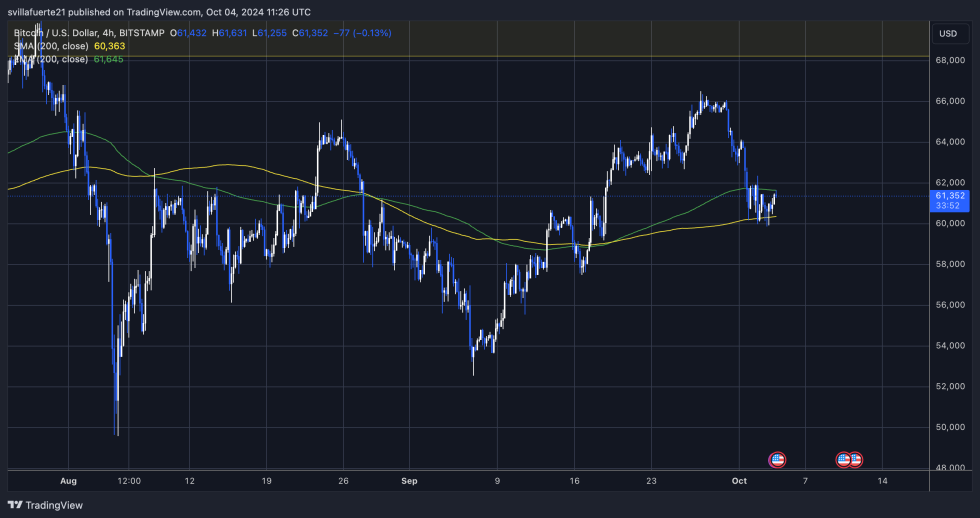
BTC needs to break above the EMA and test higher supply levels, especially around $66,000, to continue the uptrend. If successful, this could signal strong bullish momentum in the coming weeks.

However, failure to sustain price above the 200-4 hour MA could lead to a deeper correction, with potential targets around $57,500 or even lower. Traders are closely monitoring these key indicators as the current price action reflects a critical moment for Bitcoin.

The next few sessions will likely determine whether the bulls can regain control or whether a downtrend will take hold. Investors should remain vigilant as volatility may increase, influencing market sentiment and price direction. The interplay between these technical levels will be essential for traders who must navigate the uncertainty of the crypto market.

Featured image of Dall-E, chart by TradingView


Source link

Share. Facebook Twitter Pinterest LinkedIn Tumblr Email
Previous ArticleCrypto Advocacy Group Launches Initiative to Protect Blockchain Developers
Next Article Top investor sets $2,150 target if support breaks

Related Posts

Bitcoin

US-Based Bitcoin ETFs See Inflows of Around $1 Billion Last Week: Report

April 19, 2026
Bitcoin

Bitcoin Network Improves as Difficulty Decreases by 2.43% and Hash Price Increases by 13.65%

April 19, 2026
Bitcoin

Iran Ceasefire Pushes Bitcoin Above $75,000, But Can It Push It To $100,000?

April 19, 2026
Add A Comment
Leave A Reply Cancel Reply

Single Page Post
Share
  • Facebook
  • Twitter
  • Instagram
  • YouTube
Featured Content
Event

Dutch Blockchain Week 2026 strengthens position as Europe’s leading B2B blockchain event week

April 14, 2026

Amsterdam, April 2026 – Dutch Blockchain Week 2026 is rapidly evolving into one of Europe’s…

Event

Global Games Show Riyadh: The Ultimate Creator & Influencer Hub

March 31, 2026

The fast-evolving gaming ecosystem of Riyadh is powered by solid national investment, a flourishing esports…

1 2 3 … 82 Next
  • Facebook
  • Twitter
  • Instagram
  • YouTube

AAVE Price Falls 18% as KelpDAO Exploit Spreads – What Happened?

April 19, 2026

8.8 billion dollars at risk! Can crypto avoid Monday’s upheaval if US stocks crack?

April 19, 2026

The biggest DeFi hack of 2026? $294M KelpDAO exploit reaches over 20 chains

April 19, 2026
Facebook X (Twitter) Instagram LinkedIn
  • About us
  • Disclaimer
  • Terms of service
  • Privacy policy
  • Contact us
© 2026 Altcoin Observer. all rights reserved by Tech Team.

Type above and press Enter to search. Press Esc to cancel.

bitcoin
Bitcoin (BTC) $ 74,708.00
ethereum
Ethereum (ETH) $ 2,285.01
tether
Tether (USDT) $ 1.00
xrp
XRP (XRP) $ 1.41
bnb
BNB (BNB) $ 621.44
usd-coin
USDC (USDC) $ 0.995832
solana
Solana (SOL) $ 85.06
tron
TRON (TRX) $ 0.331256
figure-heloc
Figure Heloc (FIGR_HELOC) $ 1.04
staked-ether
Lido Staked Ether (STETH) $ 2,265.05