





Bitcoin came under significant selling pressure after a 16% decline since Monday – a decline that shook the confidence built during the recovery from April lows and forced participants to reassess where true structural support exists in the current market structure. Against this backdrop, CryptoQuant data has identified a specific development in miner flow data that adds a supply-side dimension to the current weakness that experienced on-chain analysts will immediately recognize.
On June 2, Bitcoin miner flows to Binance reached 24,716 BTC – the highest figure since February 5, when the metric recorded 23,151 BTC. The latest spike surpassed the February high of around 1,565 BTC, or around 6.8%, making it one of the largest miner flow events to exchanges recorded this year. This is only the second time in nearly four months that miner flows to Binance have crossed the 20,000 BTC threshold – a level that has historically attracted market attention when exceeded.
The concentration of the movement is the structural detail that makes the reading more meaningful than a generalized market-wide increase would be. The spike was not distributed evenly across exchanges – it landed specifically on Binance, making the world’s largest crypto exchange the main place where miner-related Bitcoin supply is re-emerging. When supply is concentrated in a single site at this scale, the order book dynamics of that site become the critical variable in how well the market absorbs or fails to absorb what has happened.
24716 BTC from miners in one day
CryptoQuant analysis applies the honest framework that prevents the spike in miner influx from being automatically read as a sell signal. Large miner deposits on exchanges do not confirm immediate sale intent – motivations behind a transfer of 24,716 BTC to Binance may include hedging against price risk, operational liquidity management, internal rebalancing between custody solutions, or preparation for a sale that may or may not materialize in the near term.

Bitcoin Miners to Multi Exchanges Flow | Source: CryptoQuant
What the transfer confirms is a change of state. The Bitcoin that was held by miners – removed from exchange order books and unavailable for immediate sale on the market – has now been moved to a place where it can be converted into other assets in seconds. The distance between this offer and the seller side has collapsed. Whether miners exercise this proximity immediately or hold the coins in exchange wallets without selling them, oversupply exists and the market must account for it.
The direct signal identified by the ratio depends on the duration. Miner inflows remaining high across multiple sessions would confirm a sustained distribution or selling pressure pattern – the behavioral signature of miners making a deliberate decision to reduce their holdings at current price levels. A spike that quickly fades would suggest a one-day liquidity event rather than the start of a broader trend.
Bitcoin’s price reaction in the sessions immediately following the June 2 peak is the data point that will determine the interpretation the market ultimately assigns to the largest miner-to-exchange flow event of the year.
Bitcoin tests 200-week moving average after violent breakdown
Bitcoin suffered major technical deterioration on the weekly time frame, with the price crashing more than 15% this week and dropping from the $74,000 region to nearly $62,000. The move wiped out the entire May rally and pushed BTC back into the critical support zone that defined the February cycle low.
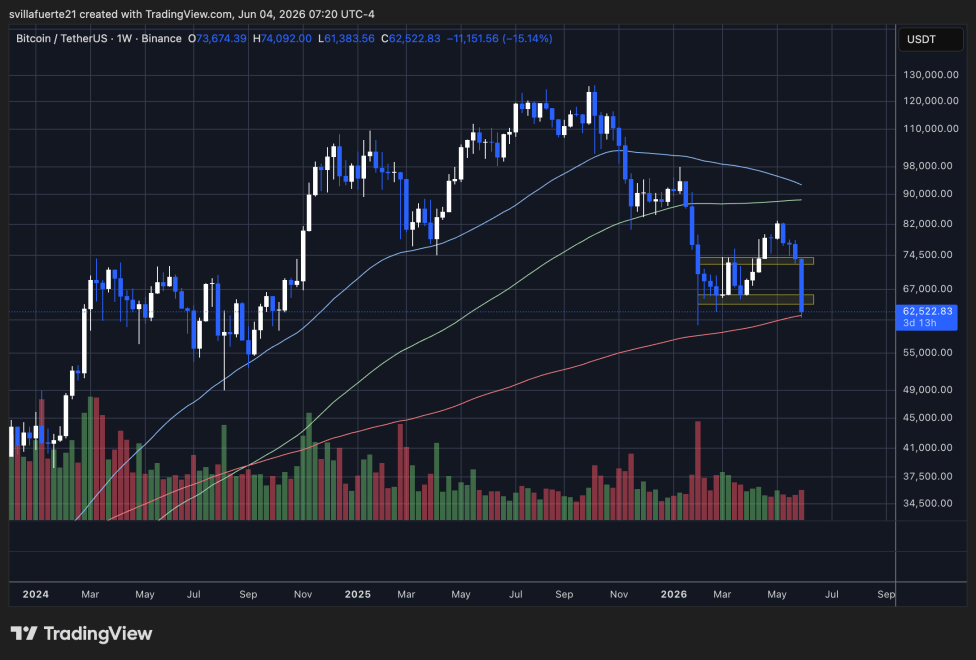
Bitcoin testing 200-week MA | Source: BTCUSDT chart on TradingView
The most significant development on this chart is Bitcoin’s return to the $61,000-$63,000 support zone. This region marked the low point of the February capitulation event and sparked the rally that ultimately took BTC above $80,000. The bulls are once again trying to defend the same level, making it one of the most important areas on the chart.
The breakdown below the $65,000 and $73,000 resistance zones confirms that sellers remain firmly in control. Both former support areas have now been lost and are likely to act as overhead resistance during any recovery attempt. The sharp rejection from the $80,000 region also established a clearly lower high compared to the late 2025 high, reinforcing the bearish structure.
However, a critical technical factor is beginning to emerge. Bitcoin is now trading directly above the rising 200-week moving average near $62,000. Historically, this moving average has been one of the strongest long-term support levels in Bitcoin history and has often marked periods of extreme value during major corrections.
If buyers successfully defend the 200-week moving average and February low region, Bitcoin could attempt to build a base for a recovery. Failure to hold this zone would expose the psychologically important $60,000 level and potentially open the door for a deeper correction towards the mid-$50,000 range.
Featured image from ChatGPT, chart from TradingView.com
Editorial process as Bitcoinist focuses on providing thoroughly researched, accurate and unbiased content. We follow strict sourcing standards and every page undergoes careful review by our team of top technology experts and seasoned editors. This process ensures the integrity, relevance and value of our content to our readers.


