


Bitcoin was trading at $79,732 as of May 7, down 2% over 24 hours, after sharply rejecting the five-month high of $82,784 reached two sessions prior. This is not very optimistic news for Bitcoin today.
The reversal brought BTC back below the psychological threshold of $80,000, a level it has now failed to maintain structurally in three separate tests in four months.
The analytical question is no longer whether Bitcoin can reach $80,000; it is a question of whether the structural conditions exist to transform this ceiling level into a floor.
On-chain data, derivatives positioning, and technical indicators are currently aligned against this conversion, even as institutional investment flows remain elevated, a divergence that defines the fragility of the current setup.
DISCOVER: Coin Supercycle: Top Performers This Week
The $80,000 Level: What Bitcoin Price Structure Really Shows
In current BTC price analysis, the four-hour chart identifies $80,513 as the immediate resistance level that Bitcoin must reclaim and close above to signal any credible bullish reaffirmation.
This level is not arbitrary; it represents the base of the supply cluster that capped the price during the late April consolidation and has since moved from support to overhead resistance after the failed breakout at $82,784.
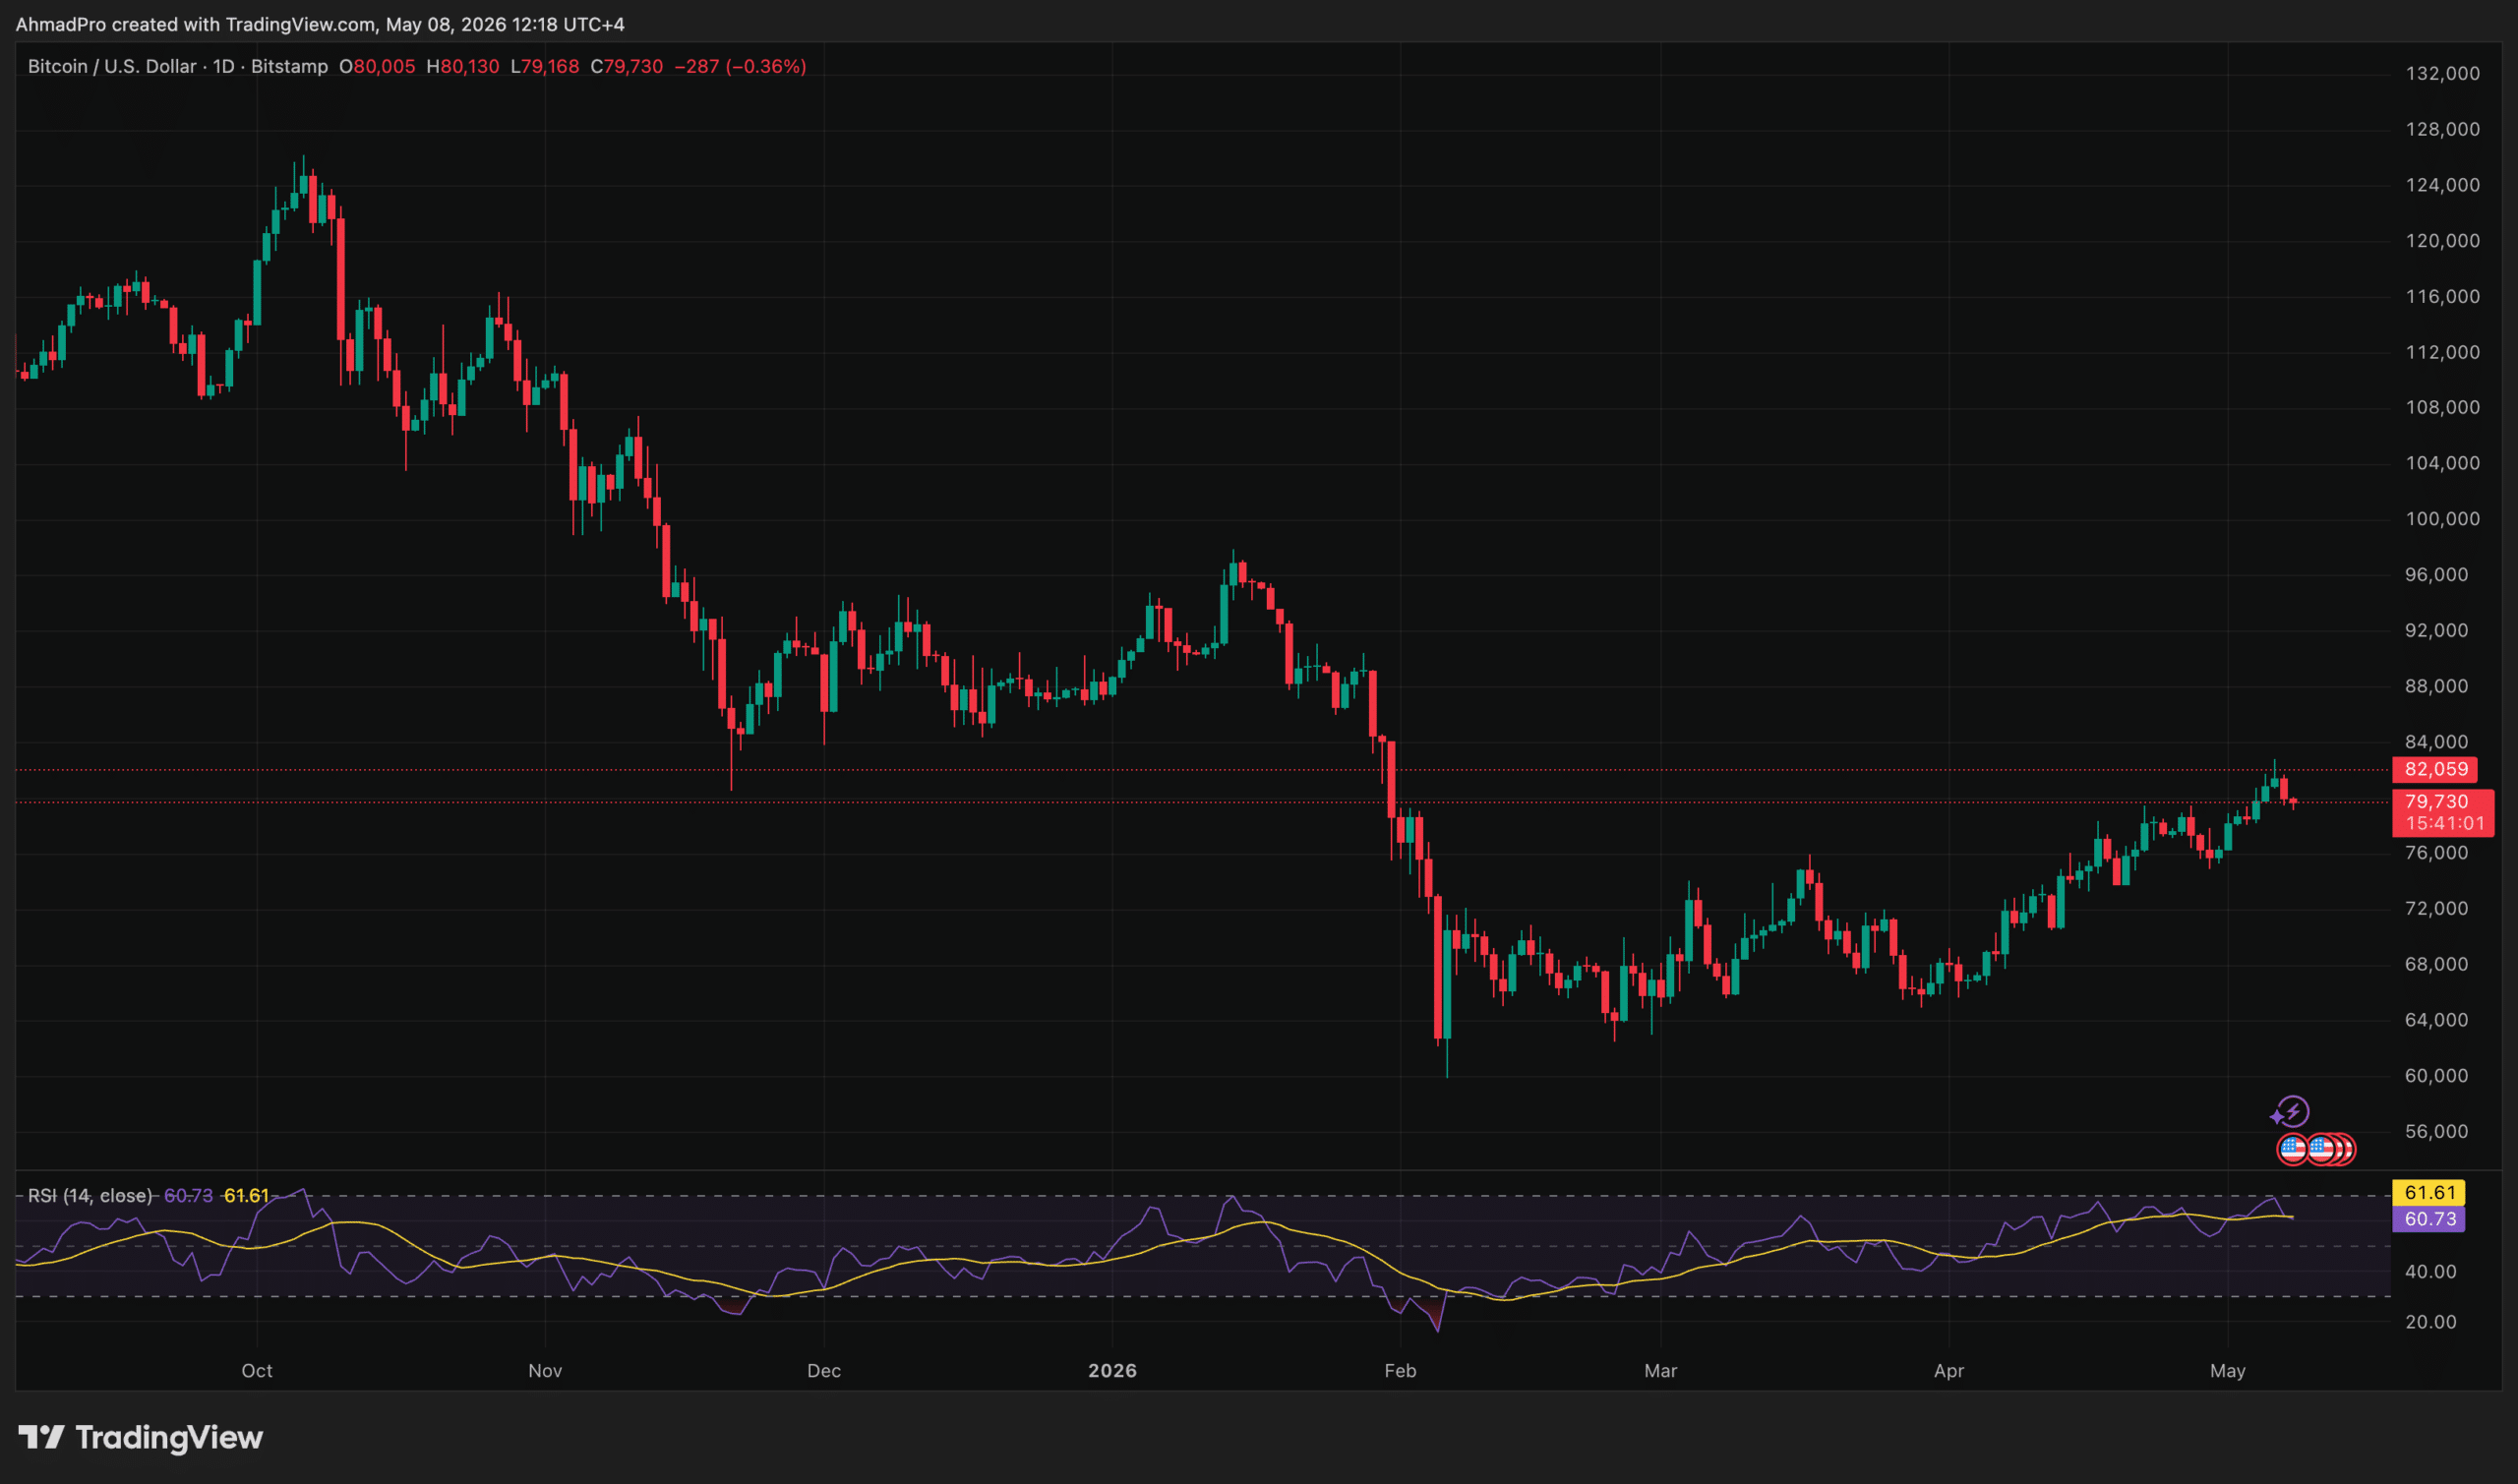
Source: Tradingview
The importance is not that Bitcoin reached $82,784; is that it was unable to close above on any significant volume. According to data tracked via TradingView, trading volume climbed 25% to $45 billion on May 7 during the push above $80,000, but declined 15% during the subsequent reversal, the classic exhaustion signature of a mechanical breakout rather than structural demand. Intraday gaps in the $81,000-$82,000 range with no sustained daily close above $80,513 confirm that the level is functioning as resistance and not a clear zone.
The immediate bearish structure places the first support at $79,135, which was already tested at press time, followed by a larger demand cluster at $74,857. The 200-day simple moving average stands at $83,435; the next important overhead target, if bulls reclaim $80,513, while the 100-day moving average at around $72,000 provides dynamic downside support. A daily close below $79,135 on high volume would signal that the current bearish structure is deepening rather than consolidating.
EXPLORE: Crypto Breakout Alerts This Week
Bitcoin News Today: Can Institutional Inflows Convert $80,000 From Cap to Floor?
If you read today’s news, it’s clear that the case for institutional investment for Bitcoin remains substantially intact. Spot Bitcoin ETFs saw $623 million in net inflows on May 1 alone, the highest daily figure in three weeks, signaling that institutional accumulation continued even as the spot price declined.
This inflow volume reflects a structural commitment to Bitcoin exposure that is categorically different from the retail demand cycles of previous years, a dynamic examined in detail in the growing positioning of Goldman Sachs’ Bitcoin ETFs and Wall Street’s growing commitment to the balance sheet.
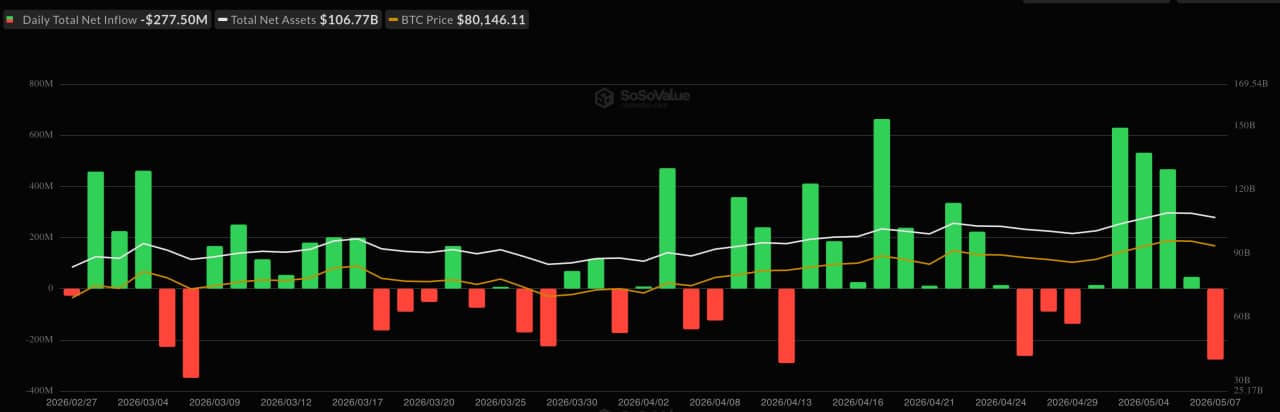
Source: SoSoValue
The complication lies in the transmission mechanism. Institutional ETF inflows do not automatically produce spot price support: they must eliminate excess derivatives before they can raise the structural floor.
Open interest in BTC futures climbed 7% to $60 billion as of May 7, according to Coinglass, concentrating liquidation risk precisely at the level where institutional buyers were piling on. This dynamic played out with mechanical precision: total BTC liquidations over a 24-hour period reached $105.45 million, with liquidations of long positions accounting for $93.87 million, compared to just $11.58 million for short positions.
The Bull Bear Power indicator quantifies what the liquidation data implies directionally. BBP turned negative on May 7, printing at 1,614 after remaining consistently positive from May 1 to May 6, the precise period that corresponded to Bitcoin’s advance toward its five-month high. Simultaneously, the Aroon Down Line reached 92.86%, a reading that is close to the 100% threshold, signaling a new low confirmed during the measurement period. Institutional flows are real; their ability to absorb this selling pressure linked to derivative products in the short term has not yet been demonstrated.
following
Disclaimer: Coinspeaker is committed to providing unbiased and transparent reporting. This article is intended to provide accurate and current information, but should not be considered financial or investment advice. Because market conditions can change quickly, we encourage you to verify the information for yourself and consult a professional before making any decisions based on this content.

Daniel Frances is a technical writer and Web3 educator specializing in macroeconomics and DeFi mechanics. Hailing from crypto since 2017, Daniel leverages his experience in on-chain analytics to write evidence-based reports and in-depth guides. He holds certifications from the Blockchain Council and is dedicated to providing “insight gain” that overcomes market hype to find real utility for blockchain.