




Key takeaways
- Bitcoin held near $76,738 on May 19 as BTC traders defended critical support at $76,000.
- Market indicators showed 9 sell signals, keeping BTC momentum mixed near 77,000.
- Bitstamp BTC/USD charts suggest that resistance at 78.5K could decide Bitcoin’s next move.
Bitcoin Chart Outlook
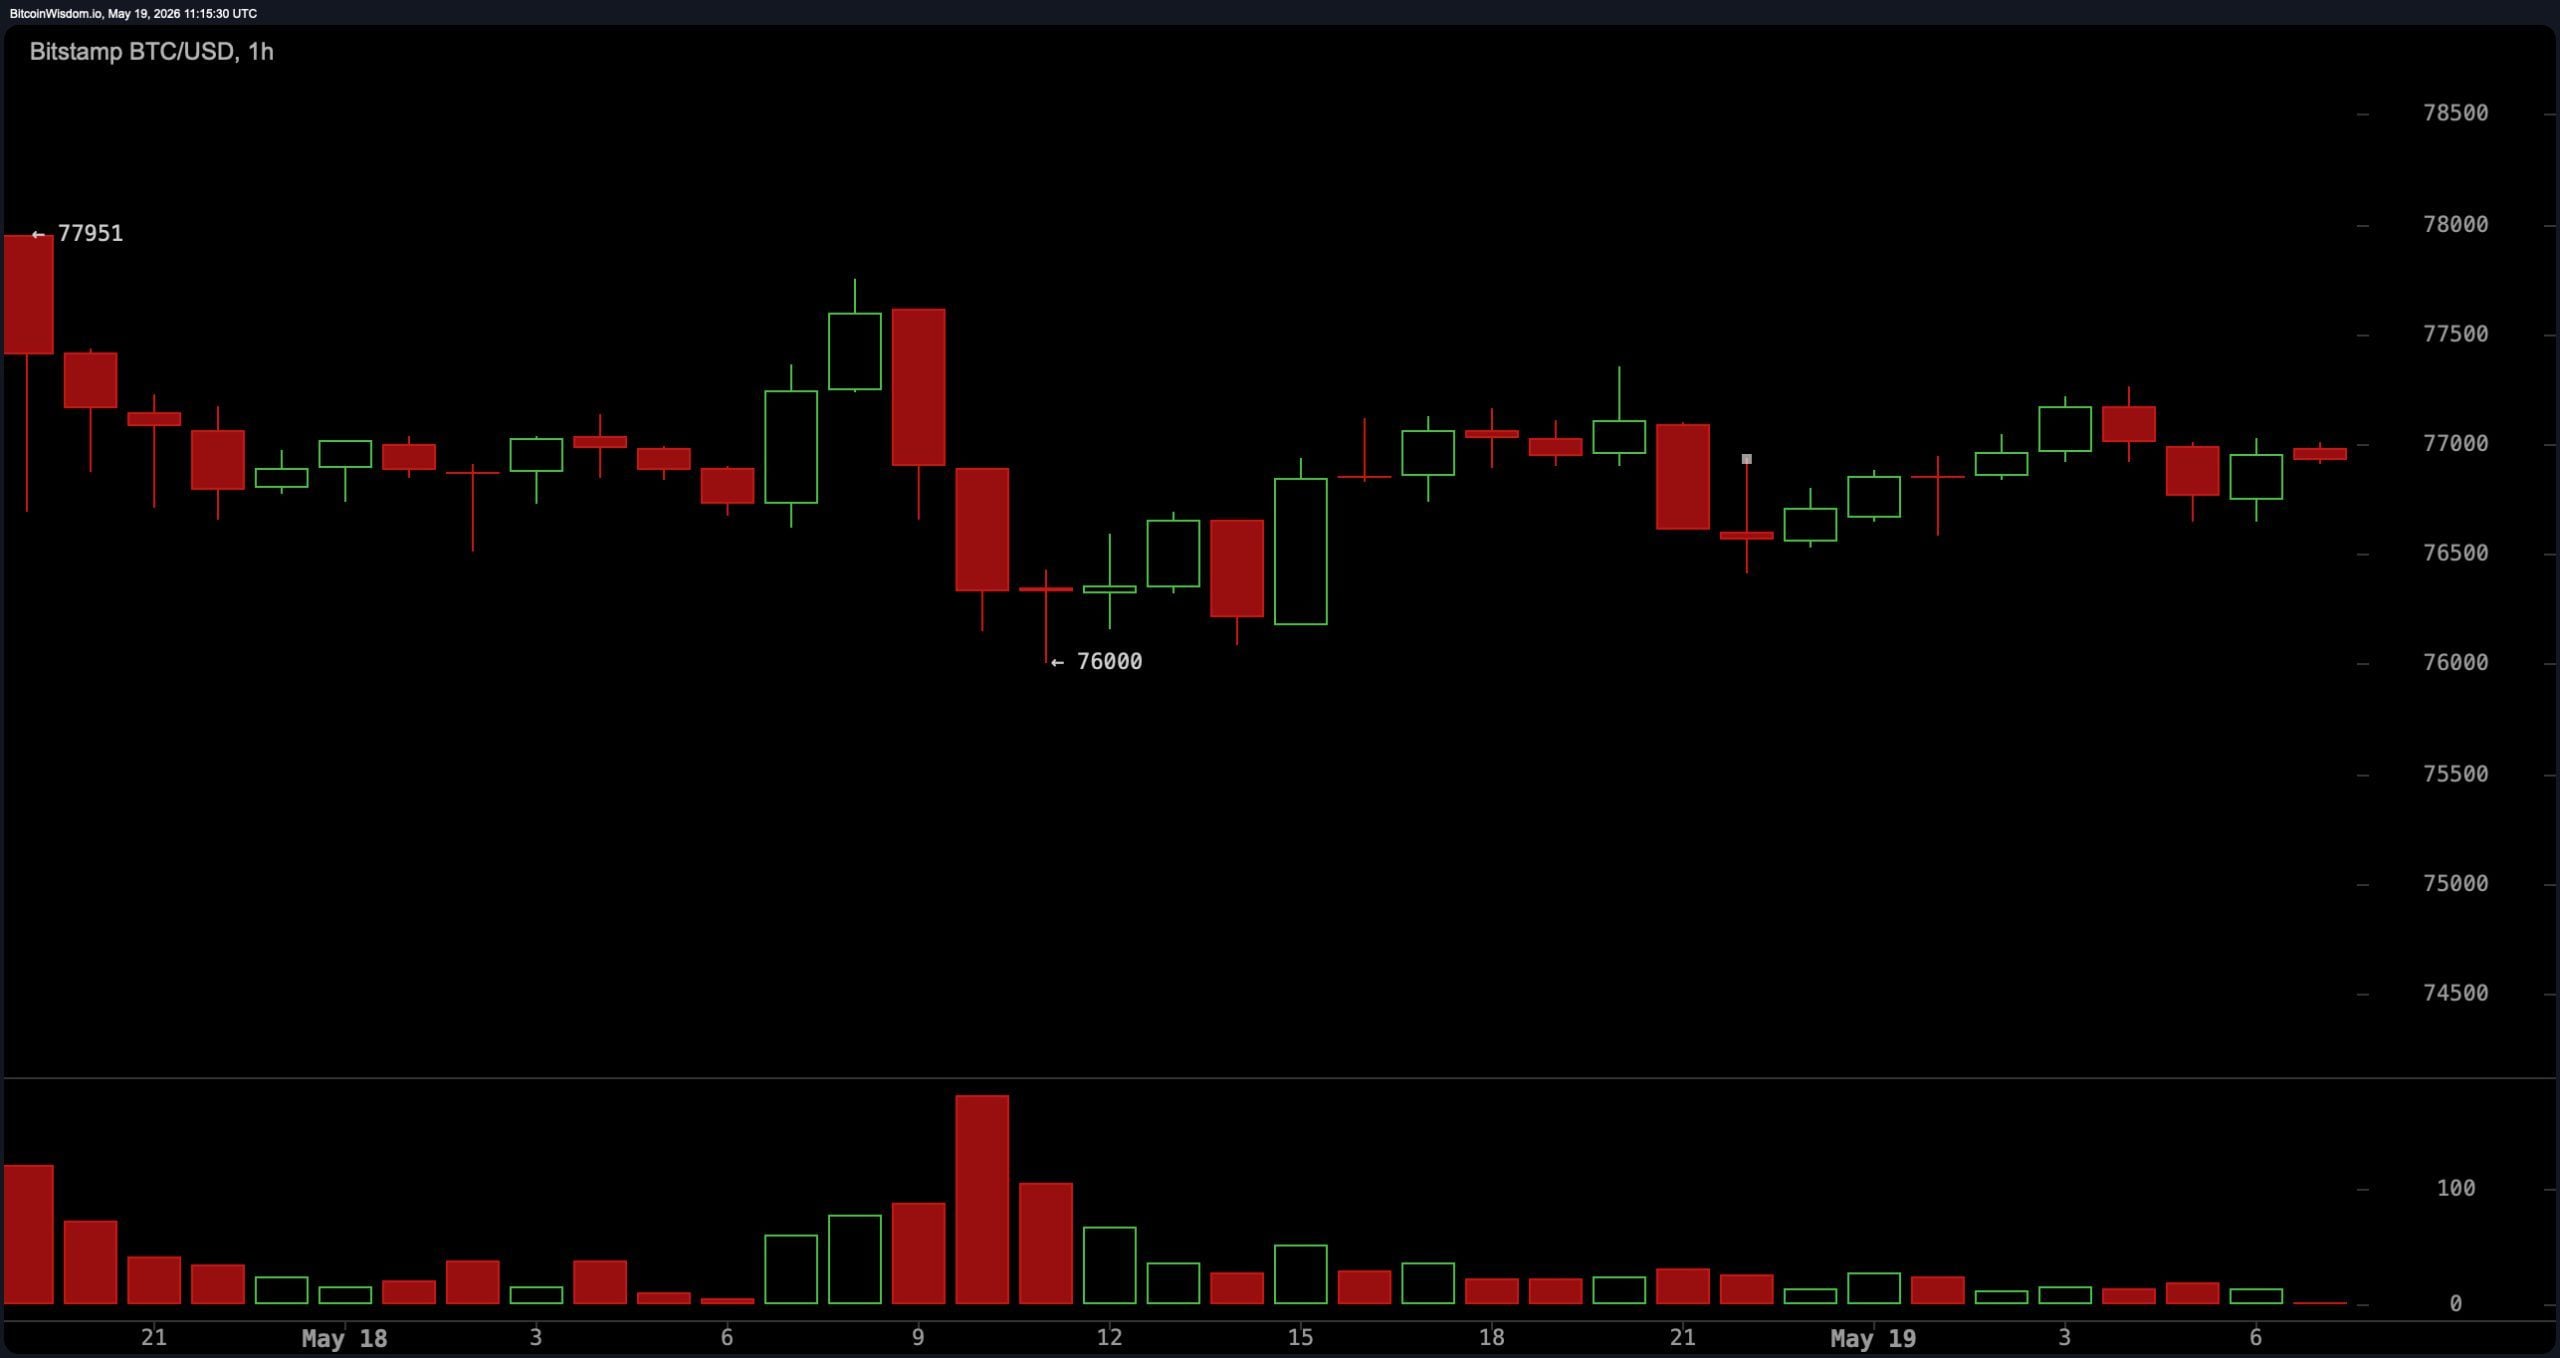
On time bitcoin chart, intraday price action remained compressed. Not much has changed since yesterday’s price action. In decline volatility and smaller candle formations reflected a market waiting for a catalyst. BTC traded within an intraday range of $76,055 to $77,666 while hovering near $77,000 throughout the session.
The consolidation near $76,000 remained intact and resistance between $77,800 and $78,500 continued to limit the upside. Get the $76,800 region back on stronger footing volume would improve in the short term bullish feeling. Hour closes below $75,800; however, this could push the price towards lower support zones.
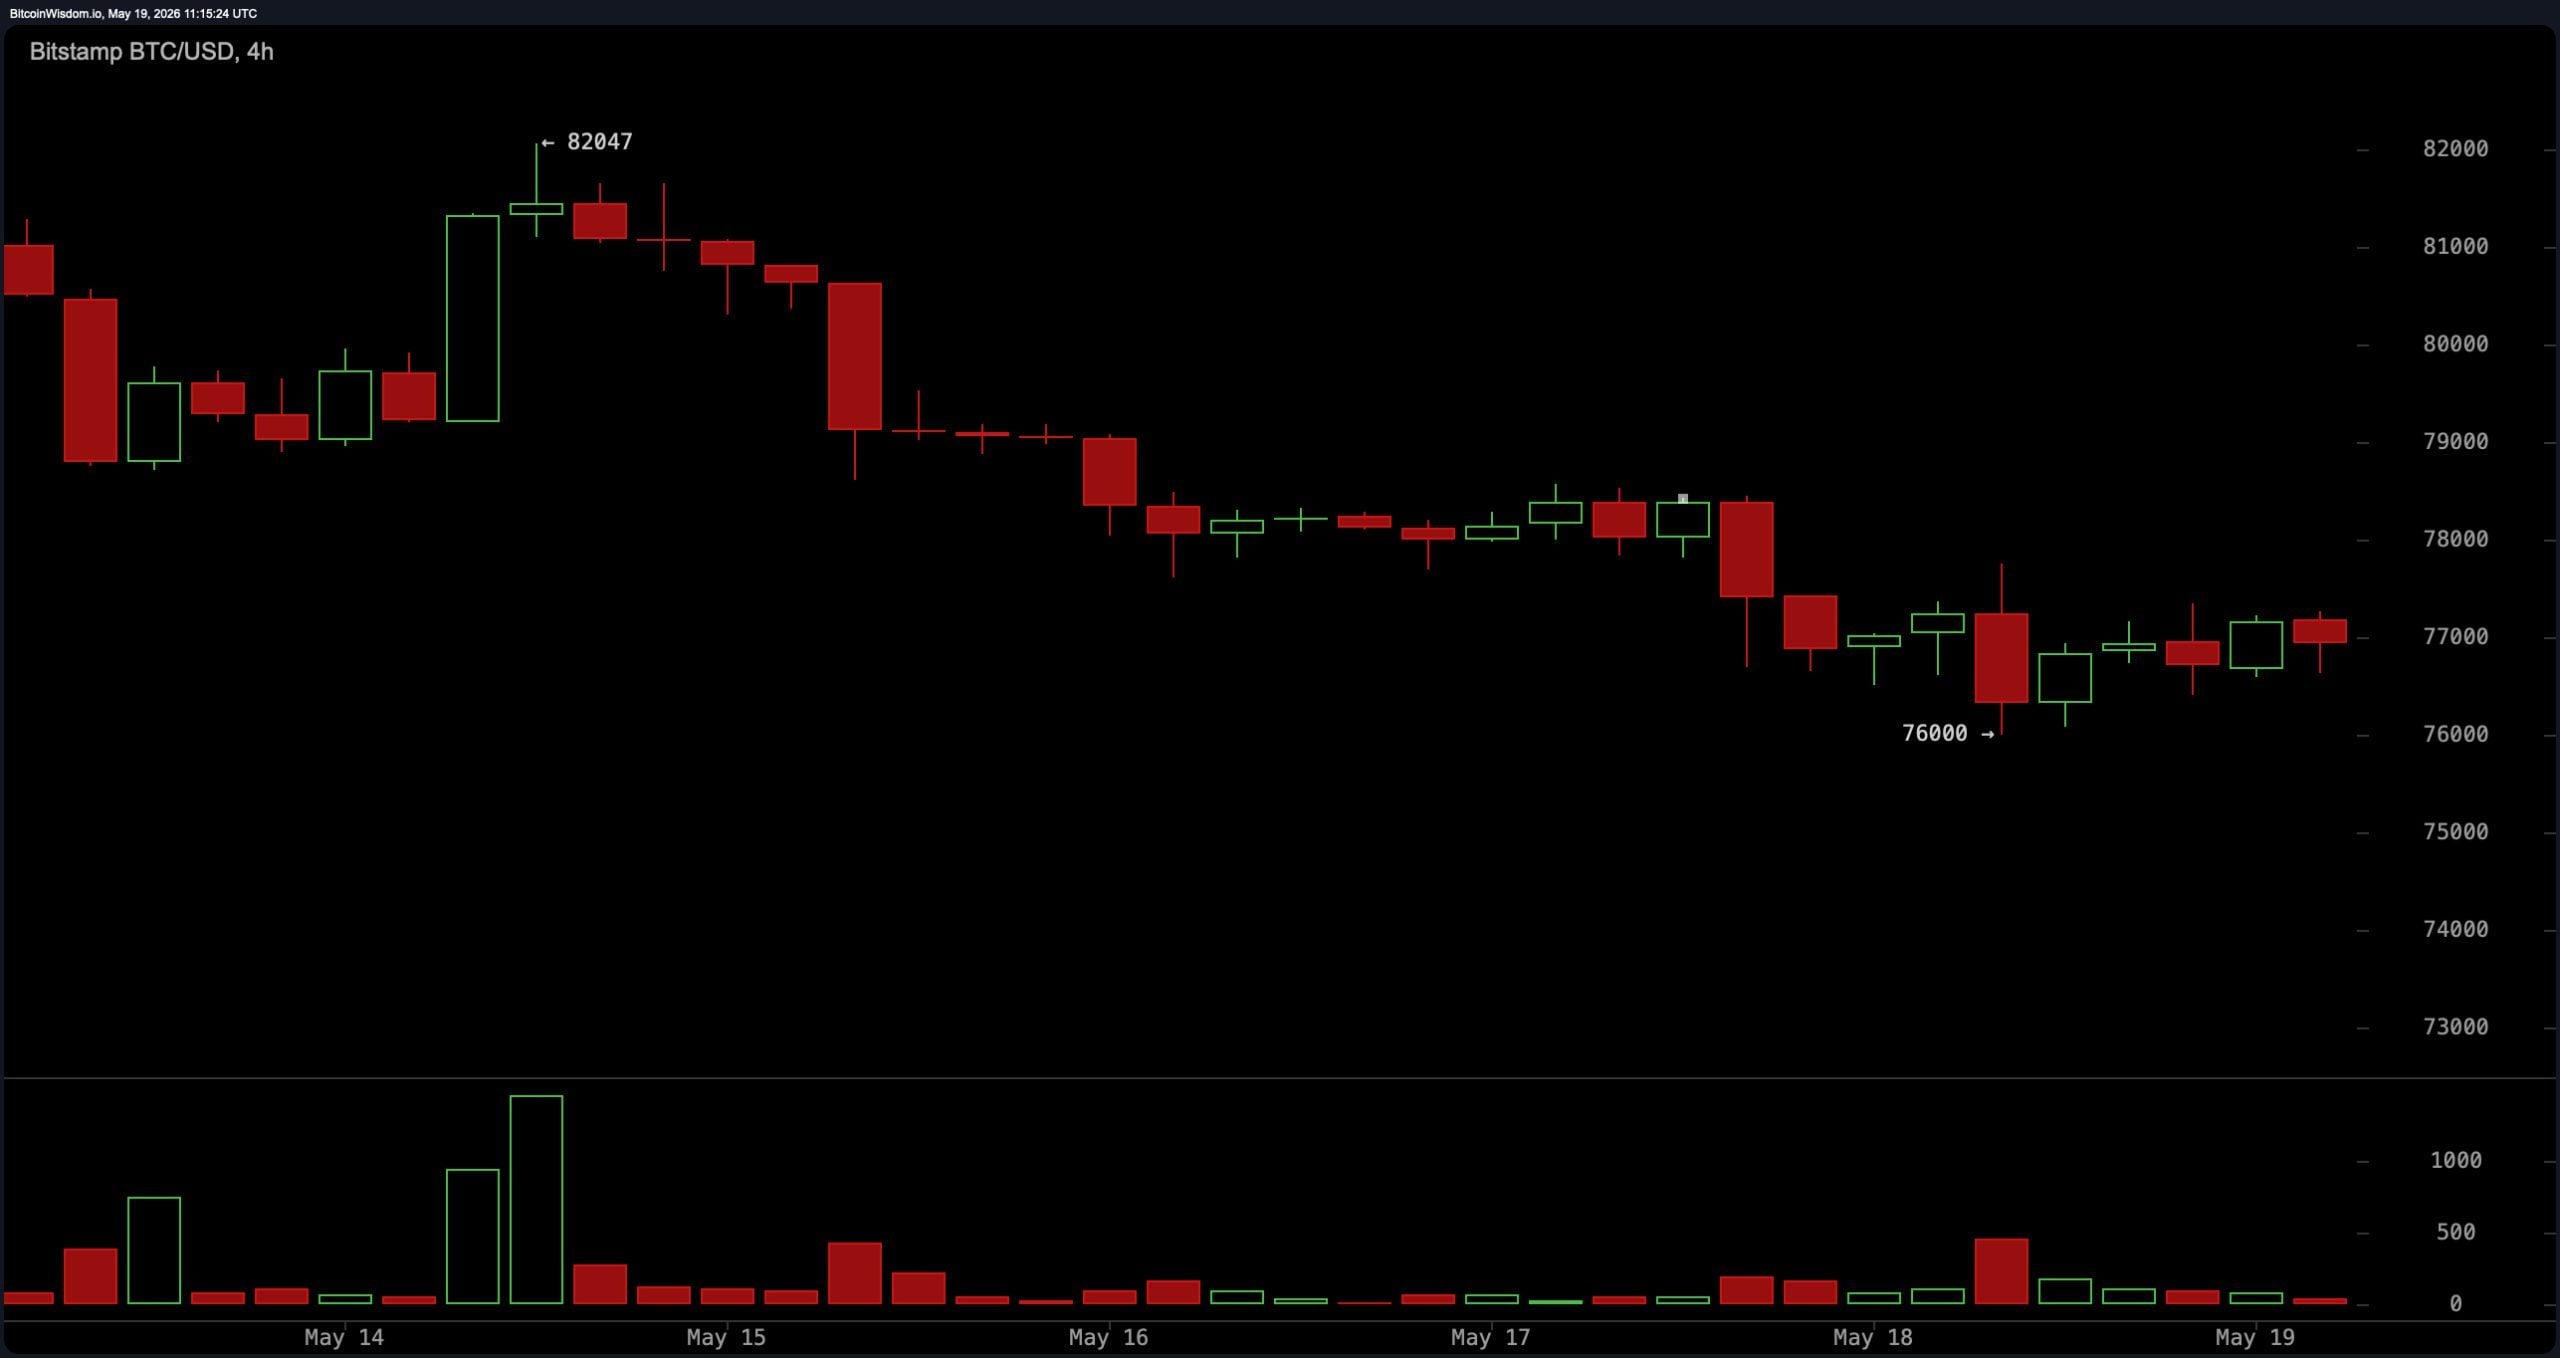
Four-hour chart shows weakening bullish momentum after Bitcoinrose from around $70,500 to recent highs near $82,800. The intermediate structure printed lower highs and lower lows – a short-term downtrend despite repeated defenses of $76,000. Traders were wondering whether the current setup represented a bear flag or a broader accumulation base.
Resistance between $78,500 and $79,000 remained the main breakout zone. A recovery with volume could pave the way to $80,000 and $81,000. Failure to maintain current support could expose BTC to downside targets near $75,000 and $74,000.
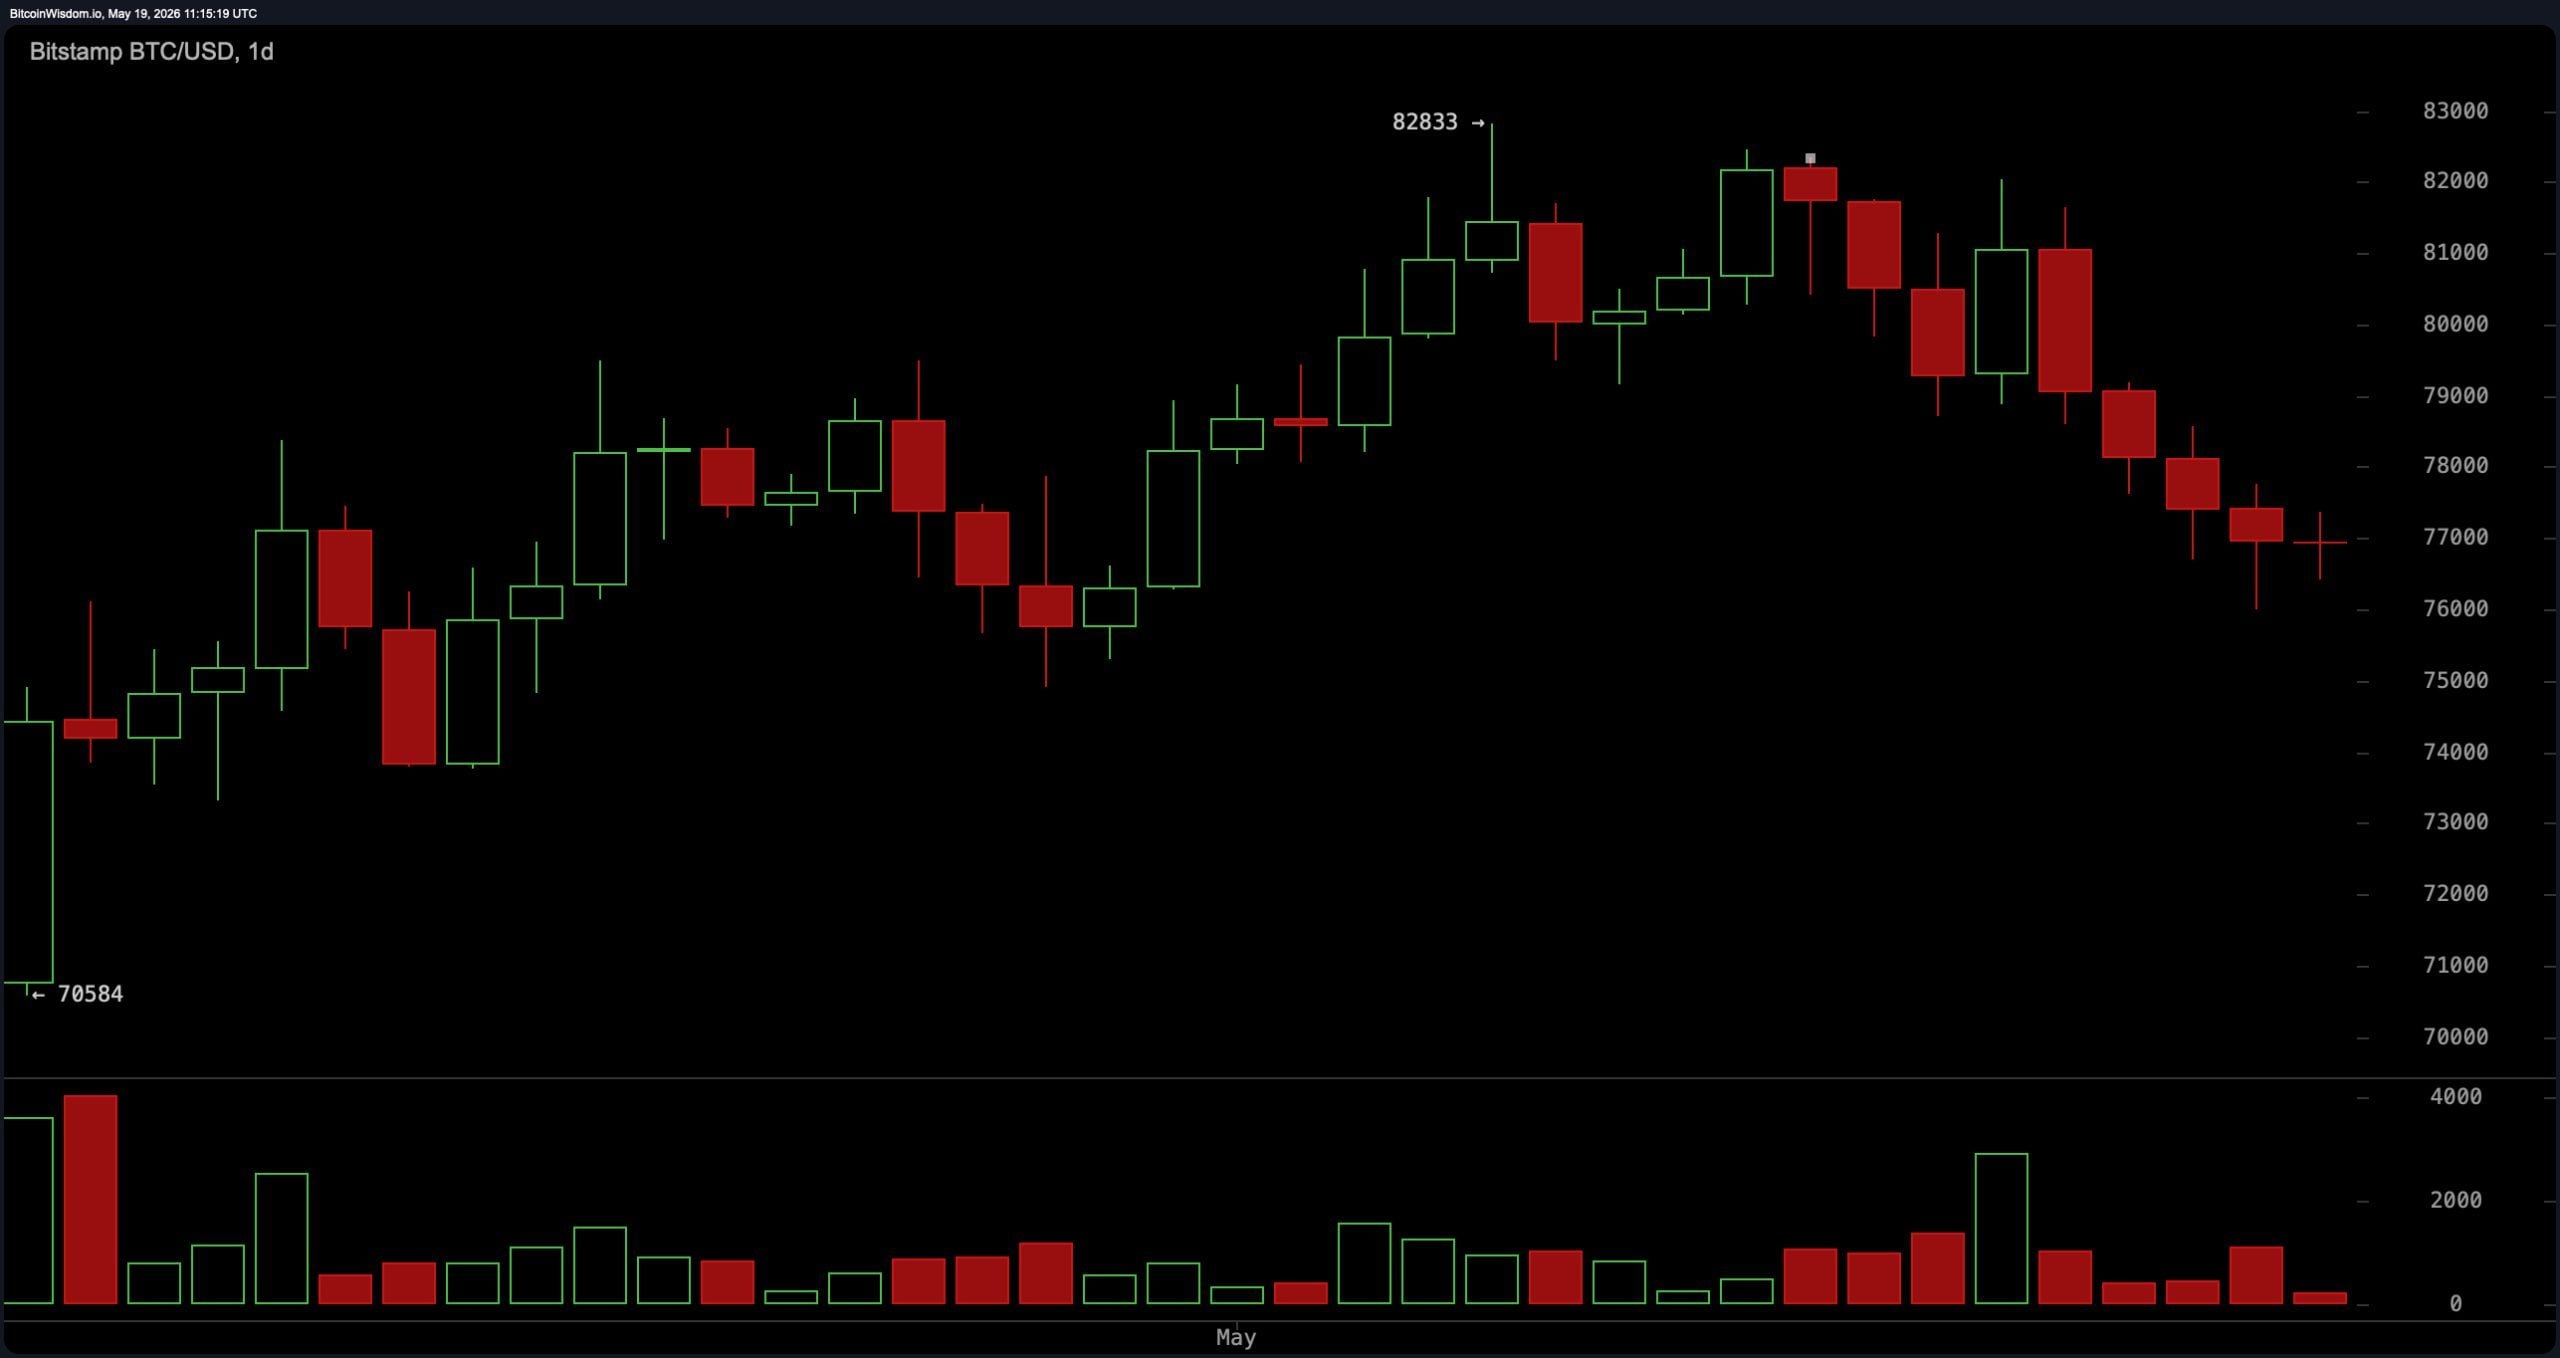
On the daily chart, bitcoin remained in a consolidation phase after its progression in recent weeks. Macro structure remains tilted bullishalthough momentum slowed near recent highs as profit-taking increased. The $80,000-$81,000 area became an important supply zone, while $76,000 remained a key technical support level.
Daily price action suggests cooling rather than confirmation bearish reversal. High but controlled sales volume pointed towards rotation rather than panic liquidation. Trading in a range between $76,000 and $79,000 remains the most likely outcome in the near term, with traders awaiting directional confirmation.
Oscillator readings reflected a generally neutral environment. THE relative strength index ( ROI) sat at 45, remaining neutral. The stochastic reading of 13 has transformed bullish. The Commodity Channel Index (CCI) at minus 116 and the Average Directional Index (ADX) at 24 both remained neutral. The Awesome oscillator at minus 299, the momentum at minus 3,733 and the MACD the level at 419 each flashed bearish figures, pointing to a weakening of the bullish momentum.
Moving averages reflect the same mixed picture. Short-term averages have fallen bearish while long-term averages continued to support the broader trend. The EMA 10, SMA 10, EMA 20, SMA 20, EMA 30 and SMA 30 are all registered bearish readings like bitcoin traded below these levels.
The EMA 50, SMA 50, EMA 100 and SMA 100 took place bullishreflecting support within the wider structure. The EMA 200 and SMA 200 remained bearish above current prices. The Ichimoku baseline remained neutral, the VWMA 20 recorded bearish conditions, and the Hull MA 9 transformed into bullish. The overall summary of the moving average remained neutral despite a slight bearish rely on short-term indicatorsrs.
Bull’s Verdict:
Bitcointhe ability to repeatedly defend the $76,000 support zone while maintaining a longer time frame bullish The structure suggests that the current pullback remains corrective rather than a confirmed reversal. A break above the $78,500-$79,000 resistance region with a volume could bring momentum back towards $80,000 and potentially recent highs near $82,800.
Bear’s Verdict:
The continued rejection below the $78,000 resistance zone along with weakening momentum indicators, including bearish Moving Average Convergence (MACD) and momentum readings, keeps the downside risk elevated in the near term. If Bitcoin decisively loses the $76,000 support level, sellers could target the $75,000-$74,000 region as broader consolidation pressure intensifies.


