




MemeCore’s native M token extended its decline over the past 24 hours, losing around 11% even as the memecoin-focused blockchain maintained a 111% gain over the past seven days.
On the surface, this withdrawal only erases about a tenth of the gains accumulated by M and reads like a routine corrective phase.
The underlying data tells a different story, with sellers gaining ground in the market in a way that could push the asset down from current levels.
Is selling pressure increasing?
Capital is contracting in MemeCore’s markets, with the gap between spot and perpetual traders narrowing as new flows flow into derivatives.
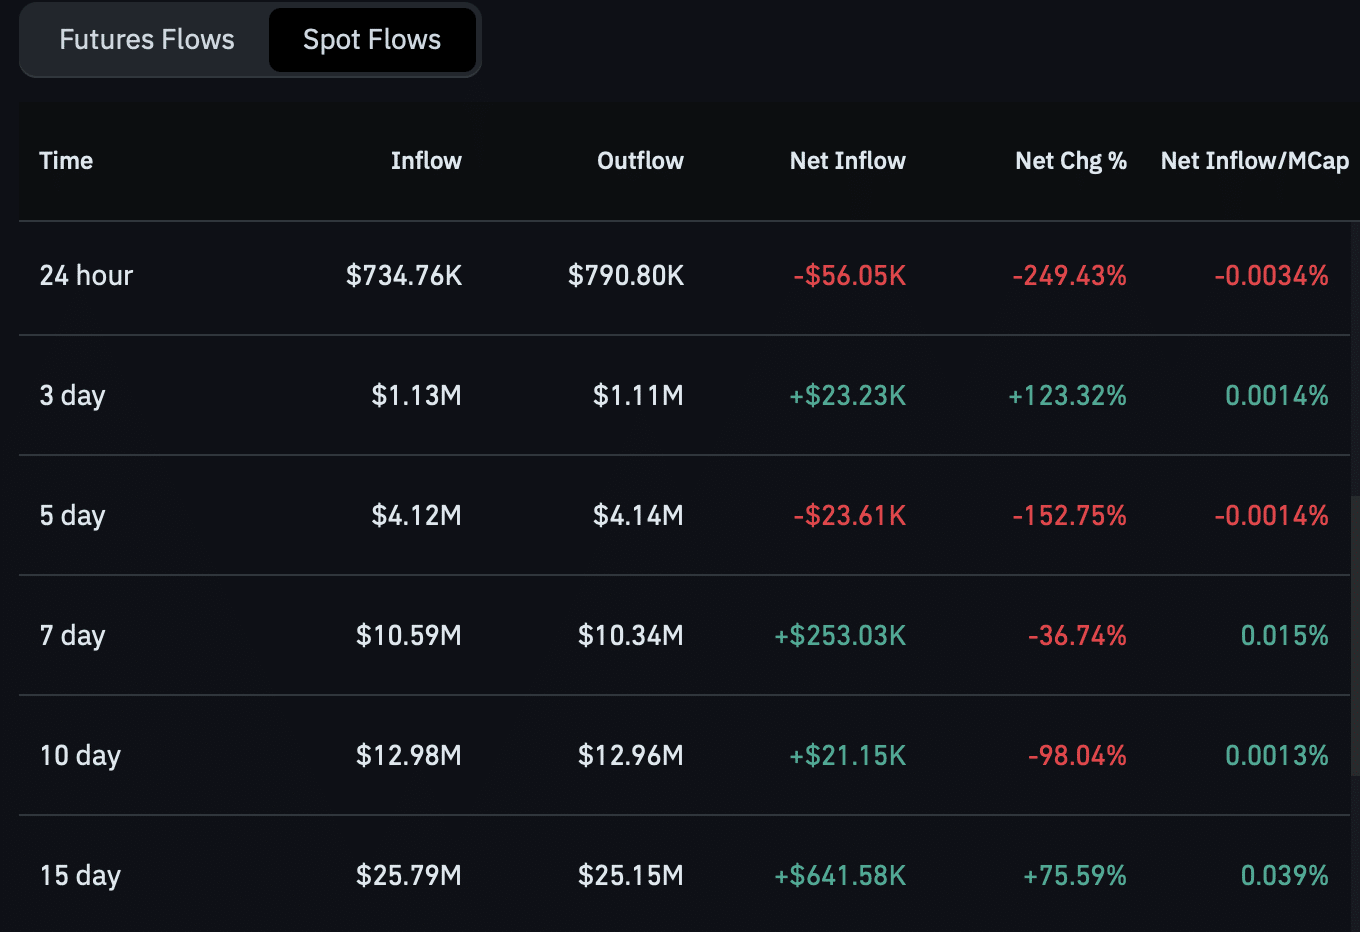
Spot Netflow data showed that buyers absorbed around $790,000 of M, while sellers offloaded around $743,000, leaving a slim net inflow of around $56,000.
This balance tilts in favor of buyers, but the advantage is too slim to trigger a decisive rally, and the imbalance becomes more pronounced in the perpetual market, where increasing flows collide with significant sales volume.
MemeCore’s perpetual contracts generated a net inflow of around $668,200, indicating more capital is being funneled into leveraged positions in M. This inflow is biased towards sellers, however, the buy-to-sell taker ratio slipped to 0.823 in the latest CoinGlass reading, meaning market sales are outpacing market purchases.
Increasing selling pressure in the perpetual market, in the face of dwindling spot capital, leaves M in a tough spot as it attempts to rebuild momentum for near-term upside.
MemeCore (M) tests a major level
MemeCore was trading in a symmetrical triangle pattern.
The formation usually develops after a strong price rally, as price consolidates between converging support and resistance lines. This trend often precedes a breakout.
M now needed to break the horizontal resistance at $1.28.
A breakout above this level would still leave the price facing the pattern’s descending resistance. The removal of both barriers could confirm a stronger upward move, while another rejection would likely prolong the consolidation.
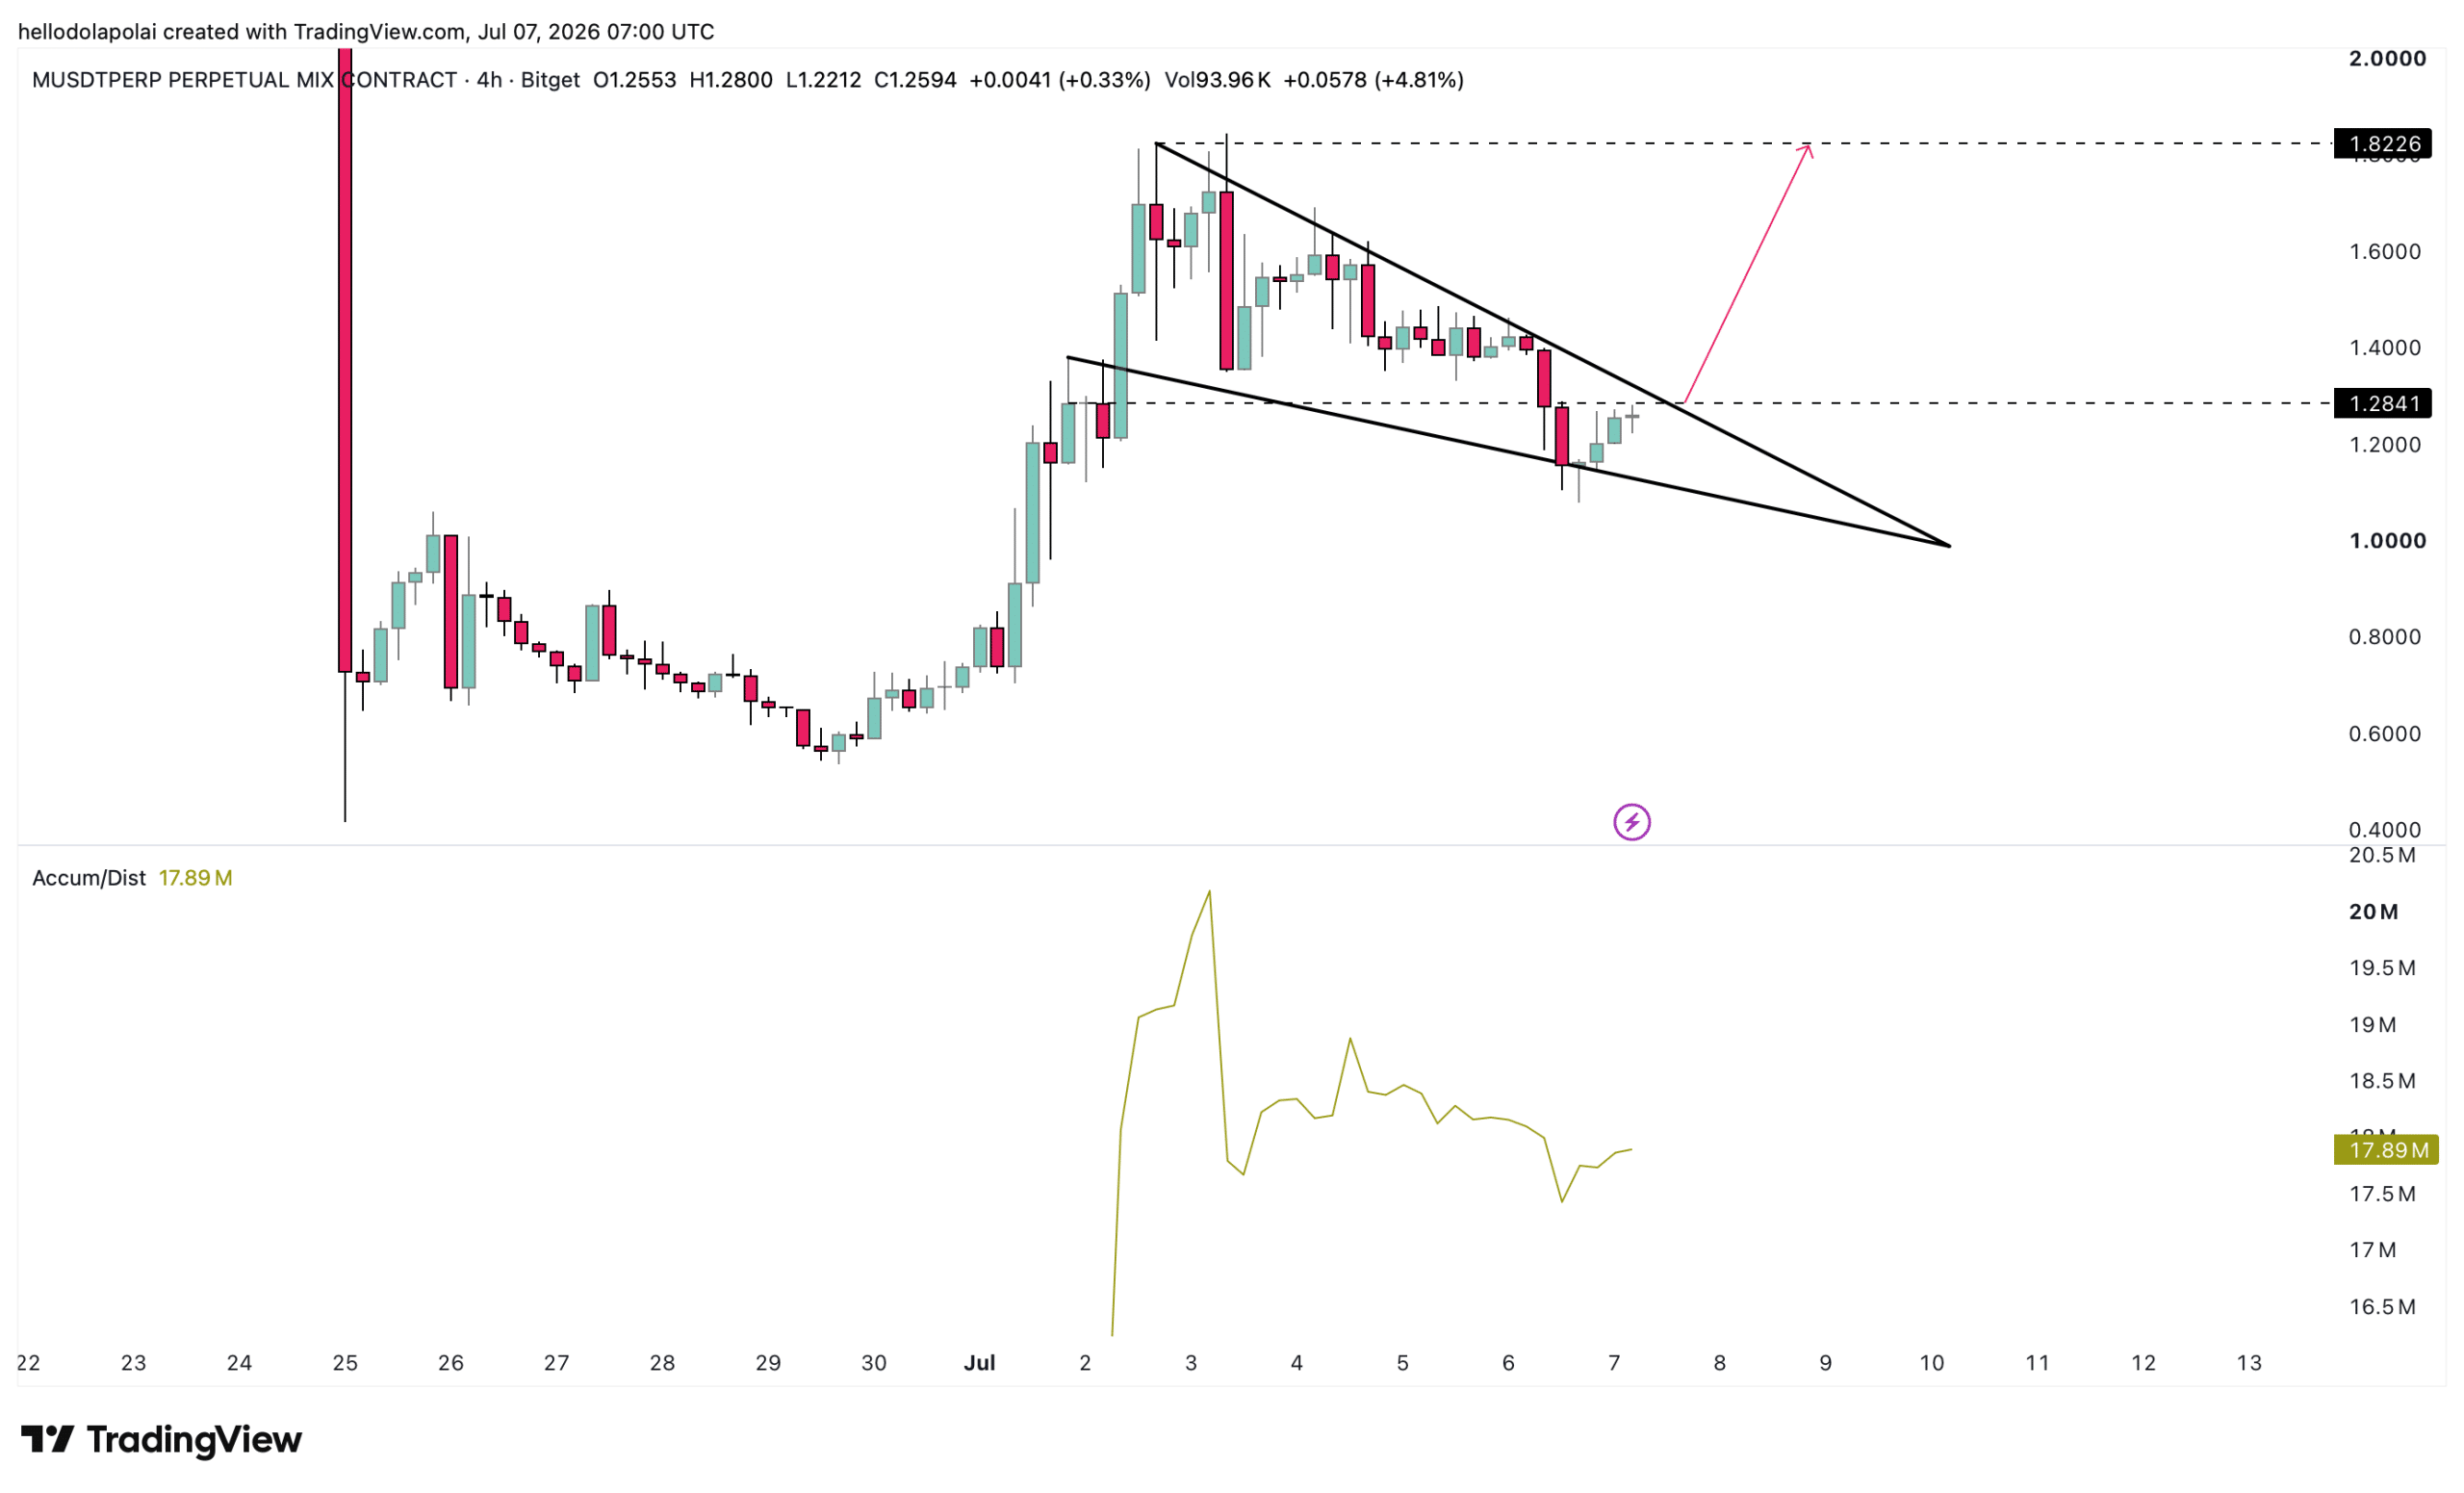
Reinforcing the pattern, the accumulation/distribution (A/D) indicator is rising, a sign that buying has outpaced selling across the market.
A sustained rise in the indicator would show accumulation below price, a dynamic that tends to support M over time.
Whales pile up as retail declines
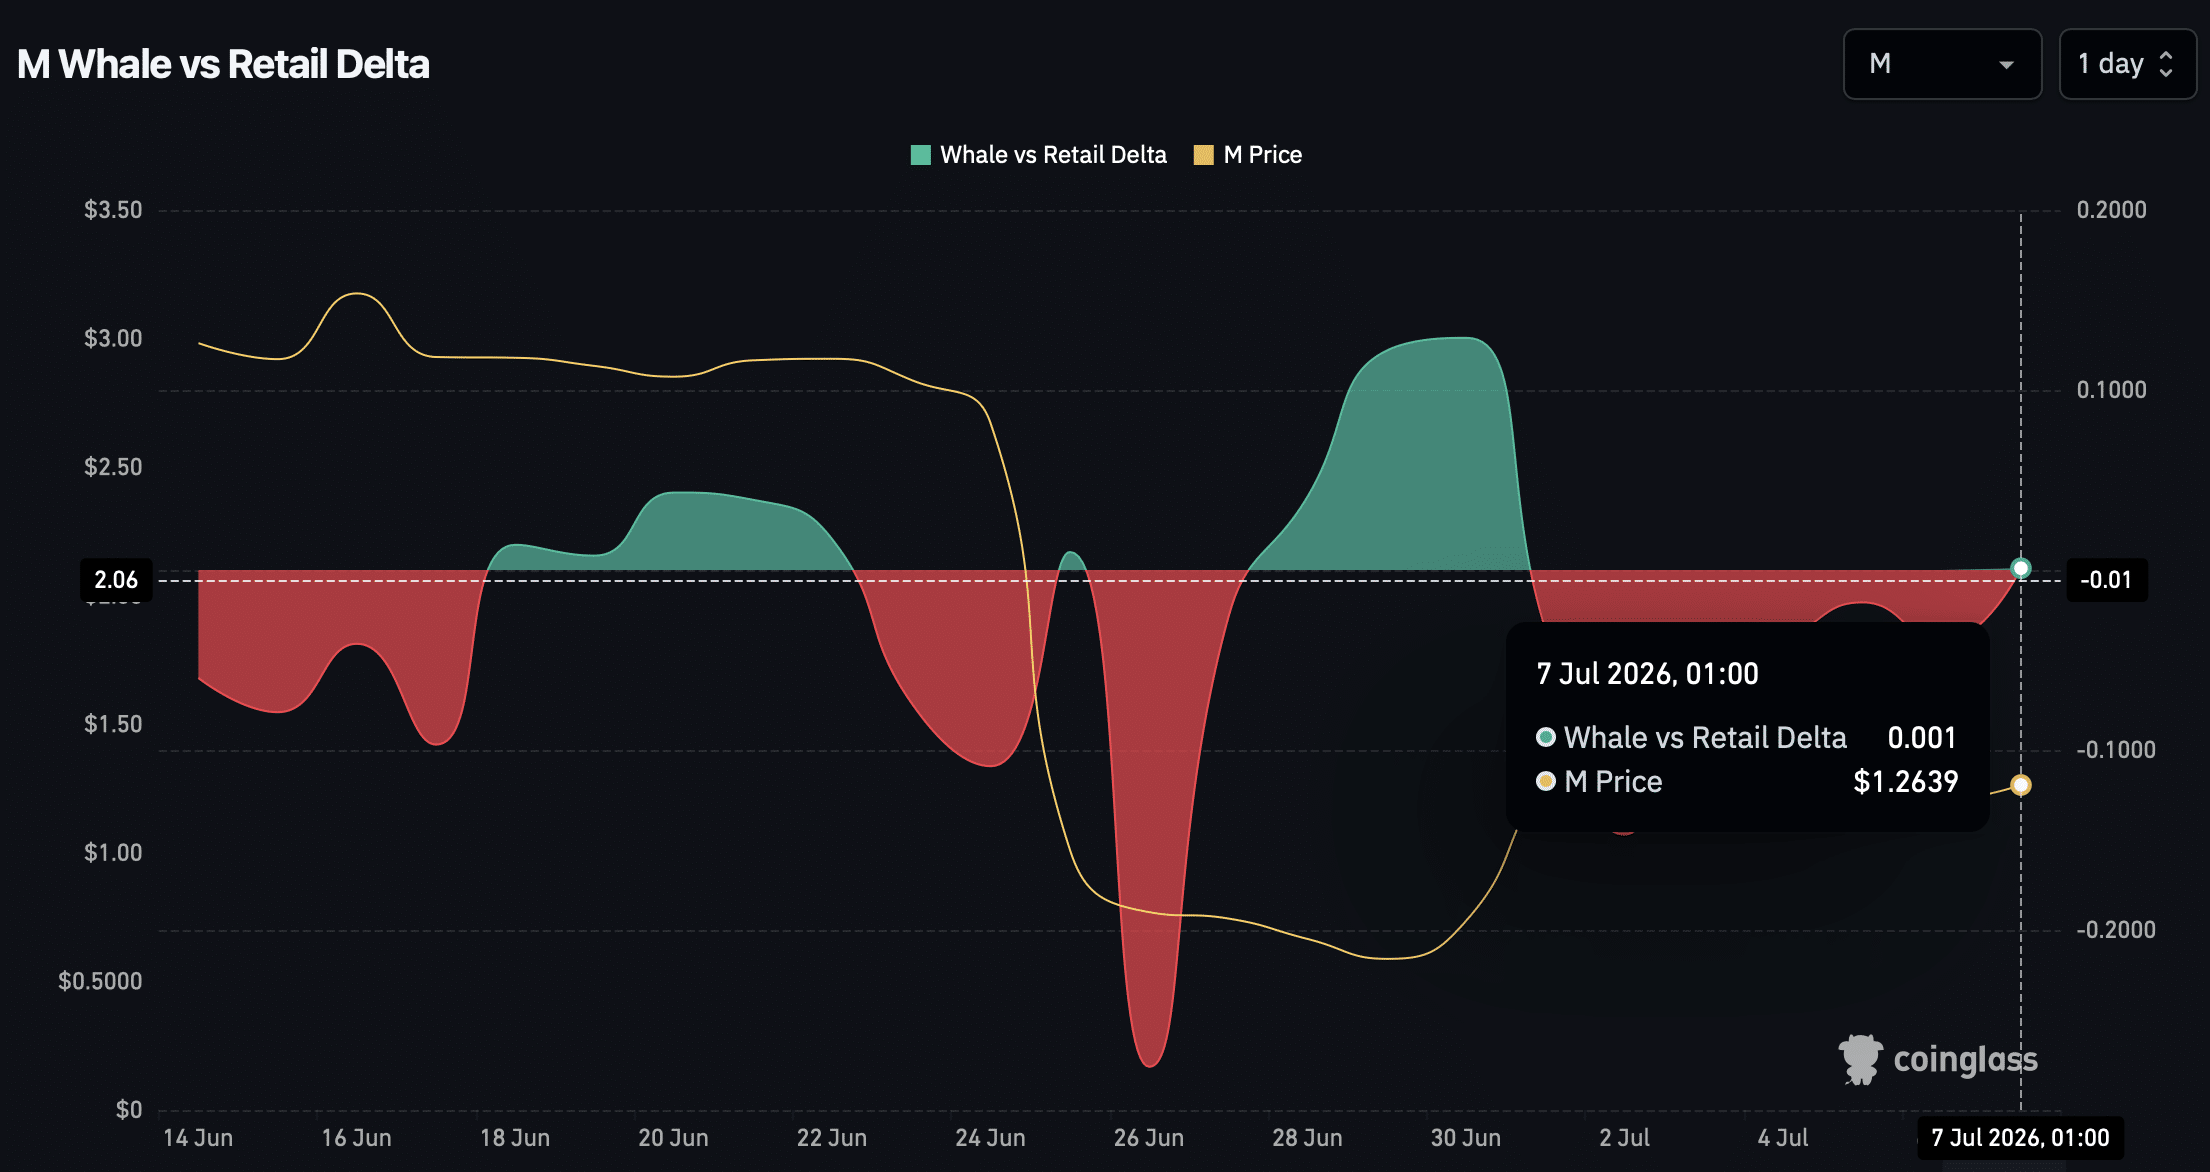
The whale-retail delta recently turned positive, albeit marginally, at 0.01, a slight advantage for large holders over retail participants.
This change indicates that whales are stepping in while retail investors are withdrawing.
Whales hold significant capital that frequently steers the direction of the market, and their positioning could prove decisive in whether M resumes its fall or rises.
Despite this, spot buying continued to outweigh selling, while most of the downside pressure came from the perpetual market. The A/D indicator also continued to point towards accumulation.
If whale accumulation continues to support spot demand, M could strengthen its rebound and build on gains seen in recent weeks.
Final summary
- MemeCore’s 11% decline coincided with increasing selling pressure in perpetual markets despite positive Spot Netflow.
- Whales piled up as retail activity weakened, offering the first signs of underlying confidence.


