





Dogecoin returned to a major long-term level on the monthly chart, setting another important test for the meme coin after months of low prices.
The setup was initially noted by crypto analyst Trader Tardigrade on X, who argued that DOGE now finds itself in a critical resistance zone where previous rallies have failed. Dogecoin has only visited this price zone twice in the past decade, and each visit ended the same way.
The model that has defined DOGE since 2015
Long term Dogecoin chart from trader Tardigrade shows DOGE trading inside a massive descending widening channel that has shaped price action for years. This channel has been shaping Dogecoin’s price action for over a decade now, with two clearly defined red trendlines gradually widening over time.
As shown in the chart below, Dogecoin already reached the upper resistance of this channel in 2017 and 2020, and both moves ended with strong rejections followed by deep corrections. Now, in 2026, Dogecoin has returned to this same overhead structure for the third time and appears poised to reject it again. As Trader Tardigrade noted, this is where we throw in Dogecoin.
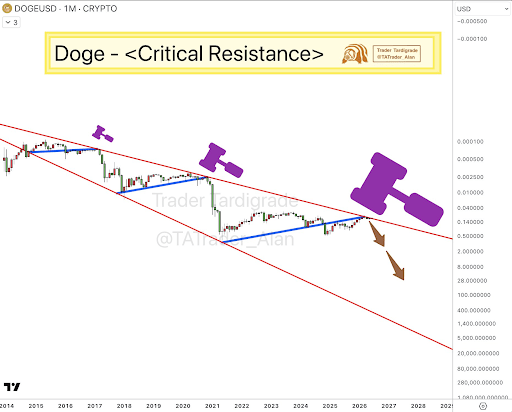
Dogecoin has already fallen 8% over the past three days, a drop that occurred shortly after the DOGE test. this major resistance zonemaking the model a strong warning.
Real message behind the inverted chart
The Tardigrade trader’s chart shows DOGE/USD on a monthly time frame, but the price scale is reversed. This means that the further down the chart moves, the more Dogecoin actually moves relative to the normal market price. Therefore, the red descending line called critical resistance is no bearish ceiling in the conventional sense, but a bullish line on an inverted chart and its rejection sends the price directly into an upward move in real terms.
In each of the previous two cases, the 2017 cycle and the 2021 cycle, a rejection of this inverted resistance was followed by a significant move downward on the inverted chart, meaning a strong rally upward on the regular DOGE chart.
Therefore, the current price action should rather be seen as a return to support, and the analyst is expect a rebound towards higher price levels. Dogecoin is currently trading at $0.0937, putting it squarely within a support range between $0.09 and $0.10.
A move above $0.10 and into the $0.15 to $0.18 range would be the first indication that sentiment around DOGE is starting to improve. However, the strongest signal would come from a breakout above $0.25as this would more clearly indicate that DOGE is bouncing off the support structure.
It is interesting to note that the structure of the inverted chart leaves room for a move to double-digit price targets before Dogecoin hits the next major trendline.
Featured image from Getty Images, chart from Tradingview.com
Editorial process as Bitcoinist focuses on providing thoroughly researched, accurate and unbiased content. We follow strict sourcing standards and every page undergoes careful review by our team of top technology experts and seasoned editors. This process ensures the integrity, relevance and value of our content to our readers.


