Close Menu
Altcoin ObserverAltcoin Observer
  • Regulation
  • Bitcoin
  • Altcoins
  • Market
  • Analysis
  • DeFi
  • Security
  • Ethereum
Categories
  • Altcoins (2,946)
  • Analysis (3,083)
  • Bitcoin (3,691)
  • Blockchain (2,157)
  • DeFi (2,619)
  • Ethereum (2,499)
  • Event (111)
  • Exclusive Deep Dive (1)
  • Landscape Ads (2)
  • Market (2,714)
  • Press Releases (11)
  • Reddit (2,375)
  • Regulation (2,461)
  • Security (3,551)
  • Thought Leadership (3)
  • Uncategorized (2)
  • Videos (43)
Hand picked
  • $150 Oil is coming. The Strait of Hormuz “Black Swan” is officially here. 3 Maneuvers to survive the NYSE open
  • UNITAS is available for exchange!
  • RENDER: Can it break the $1.88 barrier after 109% volume increase?
  • TOKEN2049 Dubai postponed to April 2027 due to regional security concerns
  • Ethereum faces resistance at $2,100 as derivatives show bearish sentiment
We are social
  • Facebook
  • Twitter
  • Instagram
  • YouTube
Facebook X (Twitter) Instagram
  • About us
  • Disclaimer
  • Terms of service
  • Privacy policy
  • Contact us
Facebook X (Twitter) Instagram YouTube LinkedIn
Altcoin ObserverAltcoin Observer
  • Regulation
  • Bitcoin
  • Altcoins
  • Market
  • Analysis
  • DeFi
  • Security
  • Ethereum
Events
Altcoin ObserverAltcoin Observer
Home»Ethereum»Ethereum network activity explodes, market structure suggests continued rise
Ethereum

Ethereum network activity explodes, market structure suggests continued rise

January 19, 2026No Comments
Share Facebook Twitter Pinterest LinkedIn Tumblr Reddit Telegram Email
Share
Facebook Twitter LinkedIn Pinterest Email


Ethereum is showing signs of strength on two critical fronts at once. On-chain activity has reached record levels, reflecting higher real-world usage across the network, while the long-term technical structure is leaning towards continued upwards.

Together, these signals suggest that Ethereum’s current phase could be more than just a sideways move, as the underlying data indicates sustained demand and constructive price behavior.

Related reading

Ethereum Daily Transactions Hit New High

Ethereum price action is turning bullish with a steady increase in recent days. Notably, on-chain data shows that this increase comes on top of consistent on-chain activity in recent days.

Data from Ethereum’s on-chain activity shows that daily transactions recently climbed to around 2.8 million, setting a new all-time high for the network. Interestingly, this figure is not only a record high, but also because it is approximately 64% higher than the daily trading levels seen during the peak of the 2021 bull market.

Chart data from Sentora illustrates a progression showing Ethereum’s transaction count steadily increasing over the years and increasing in early 2026.

Comparison of transaction activity to 2021 adds more context given the intense activity the Ethereum network was witnessing at the time. At the time, Ethereum was at the center of an altcoin season and an NFT boom, all of which contributed to an increase in transaction activity and a push to new price highs.

BTCUSD is currently trading at $3,334. Chart: TradingView

The fact that Ethereum is now processing significantly more transactions per day compared to 2021 shows that its network usage has moved beyond speculative behavior. The steady increase in transaction activity shows the scale of the use of decentralized finance and stablecoin settlement, among others.

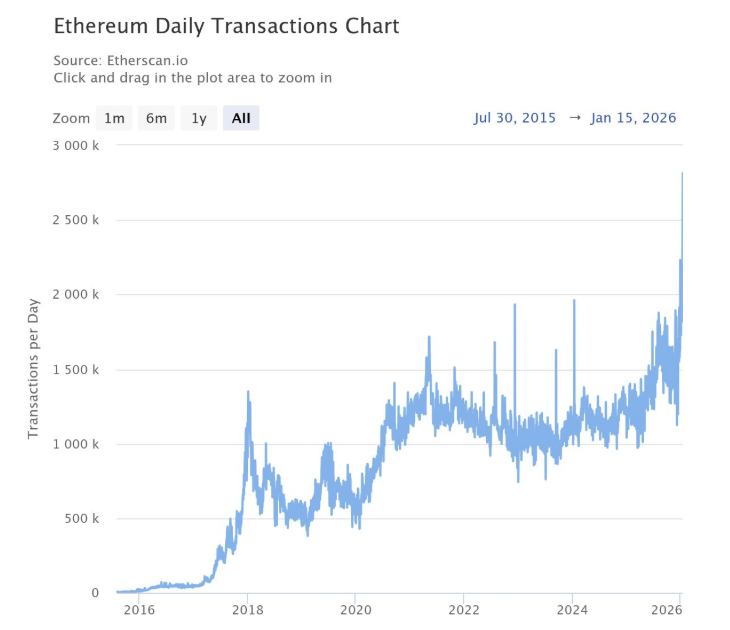
Ethereum daily transactions chart. Source: @SentoraHQ on X

Ethereum reaccumulation in a macro bullish trend

Technical analysis of Ethereum market capitalization over a three-week candlestick period shows that the cryptocurrency is still trading in a stability zone. In particular, technical analysis made by a crypto analyst Egrag Crypto suggests Ethereum is present reaccumulation in a macro bullish trend.

A look at the 3-week time frame shows that the ETH market cap is holding above the 21 EMA, respecting the ascending macro trendline, printing higher highs and lower lows, and compressing below historical resistance. This is constructive behavior, not weakness.

History shows that periods where Ethereum’s market cap remained above the 21 EMA over this period led to expansion phases, while sustained moves below marked bear market conditions.

Related reading

Currently the structure indicates the The support of the EMA is defended. From a probabilistic perspective, the current pattern leans toward continuation rather than collapse. A move through the overhead resistance band would likely confirm an expansion phase and allow Ethereum to continue a 70-75% bullish continuation.

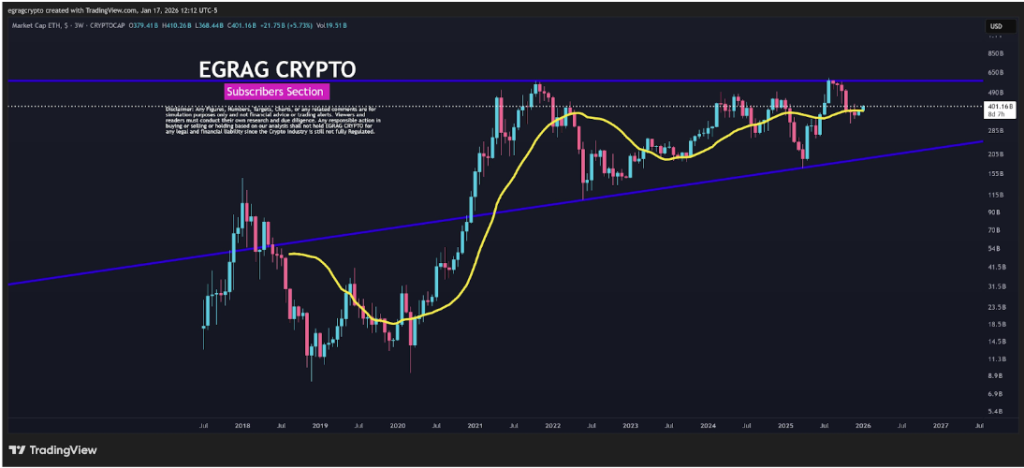
ETH market capitalization. Source: @egragcrypto on X

On the other hand, a bearish outcome will become possible if the price action loses the 21 EMA on the three-week chart. This could validate a deeper 25-30% correction towards the lower trendline, but this scenario carries a lower probability.

Featured image from Unsplash, chart from TradingView


Source link

altcoins bitcoin crypto eth ether ethereum ethusd
Share. Facebook Twitter Pinterest LinkedIn Tumblr Email
Previous ArticleA local bank spreading FUD years after other entities tried to kill it or slow it down
Next Article how government agencies actually solve crypto cases

Related Posts

Ethereum

Corporate Demand for Ethereum Pushes Treasury Holdings of ETH to All-Time High

March 12, 2026
Ethereum

Are Ethereum Treasury Companies Still in the Game? Here’s what they did

March 12, 2026
Ethereum

Ethereum Wallet Growth Goes Parabolic, Outpaces Major Cryptos

March 12, 2026
Add A Comment
Leave A Reply Cancel Reply

Single Page Post
Share
  • Facebook
  • Twitter
  • Instagram
  • YouTube
Featured Content
Event

Istanbul Blockchain Week Launches Institutional Markets Summit: Pioneering Institutional Adoption of Digital Assets

March 12, 2026

Istanbul, Türkiye – March, 2026 – Istanbul Blockchain Week announces the launch of The Institutional…

Event

HIPTHER Baltics Launches in Vilnius with Agenda Revealing Lithuania’s 2026 Regulatory Reset

March 10, 2026

Vilnius, Lithuania — HIPTHER officially announces the agenda for HIPTHER Baltics: Vilnius 2026, the inaugural event of its…

1 2 3 … 77 Next
  • Facebook
  • Twitter
  • Instagram
  • YouTube

RENDER: Can it break the $1.88 barrier after 109% volume increase?

March 13, 2026

Crypto exchange AAVE costs nearly $50 million lost: ETH MEV pocketed $9.9 million

March 13, 2026

Mastercard Adds Polygon Payments: Assessing On-Chain Impact

March 13, 2026
Facebook X (Twitter) Instagram LinkedIn
  • About us
  • Disclaimer
  • Terms of service
  • Privacy policy
  • Contact us
© 2026 Altcoin Observer. all rights reserved by Tech Team.

Type above and press Enter to search. Press Esc to cancel.

bitcoin
Bitcoin (BTC) $ 73,398.00
ethereum
Ethereum (ETH) $ 2,188.73
tether
Tether (USDT) $ 0.99998
bnb
BNB (BNB) $ 675.14
xrp
XRP (XRP) $ 1.45
usd-coin
USDC (USDC) $ 0.999912
solana
Solana (SOL) $ 92.07
tron
TRON (TRX) $ 0.289226
figure-heloc
Figure Heloc (FIGR_HELOC) $ 1.01
staked-ether
Lido Staked Ether (STETH) $ 2,265.05