


- Polygon’s DeFi TVL hit a 7-month high of $1.16 billion.
- Despite the network’s growth, POL has still shown bearish signals with a rounded trend on its four-hour chart.
POL (formerly MATIC) came under downward pressure after falling almost 20% in 30 days.
As AMBCrypto reported, over 98% of POL holders are sitting on losses, highlighting the negative market sentiment.
POL was trading at $0.324 at press time. Data from CoinMarketCap shows that trading volumes fell by 5%, suggesting a decline in trader interest in the altcoin.
Despite the drop in prices, the Polygon network has seen renewed activity, particularly in decentralized finance (DeFi).
Polygon DeFi TVL hits 7-month high
Polygon’s DeFi total value locked (TVL) stood at $1,164 at the time of publication by DeFiLlama. TVL is at its highest level since March, showing increasing usage of DeFi applications built on the network.
At the same time, DeFi volumes recorded gradual growth to reach $267 million at press time. The last time Polygon’s DeFi volumes reached these levels was also in March.
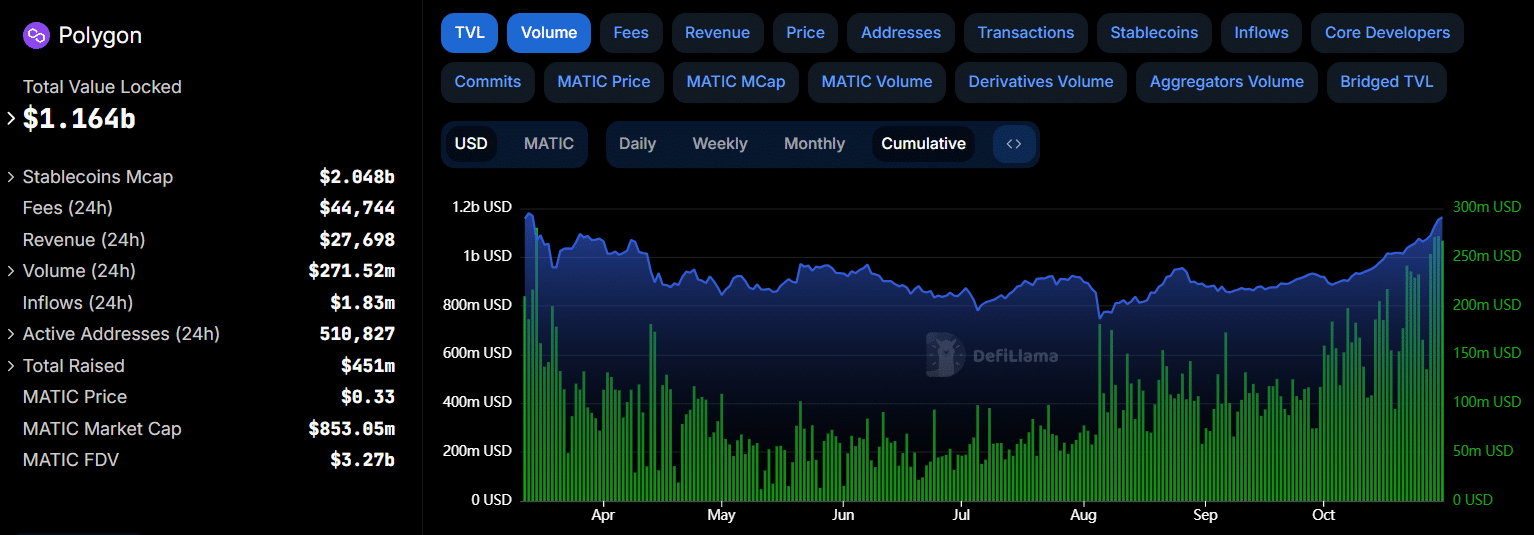
(Source: DeFiLlama)
The main app driving the increase is betting site Polymarket, which accounts for $353 million of the network’s TVL.
This month alone, Polymarket’s TVL has almost tripled, with the upcoming US elections a catalyst for this growth.
Despite this positive data, the POL token continues to generate bearish signals.
POL forms a rounded top pattern
The polygon appears to curl to form a rounded top pattern. This is a bearish reversal pattern that suggests POL is fading from its uptrend as selling pressure gradually increases.
POL will complete the top rounding pattern if it falls to test support at $0.31.
If POL establishes this neckline and breaks through this support, it could create a sell signal that could cause prices to plunge lower.
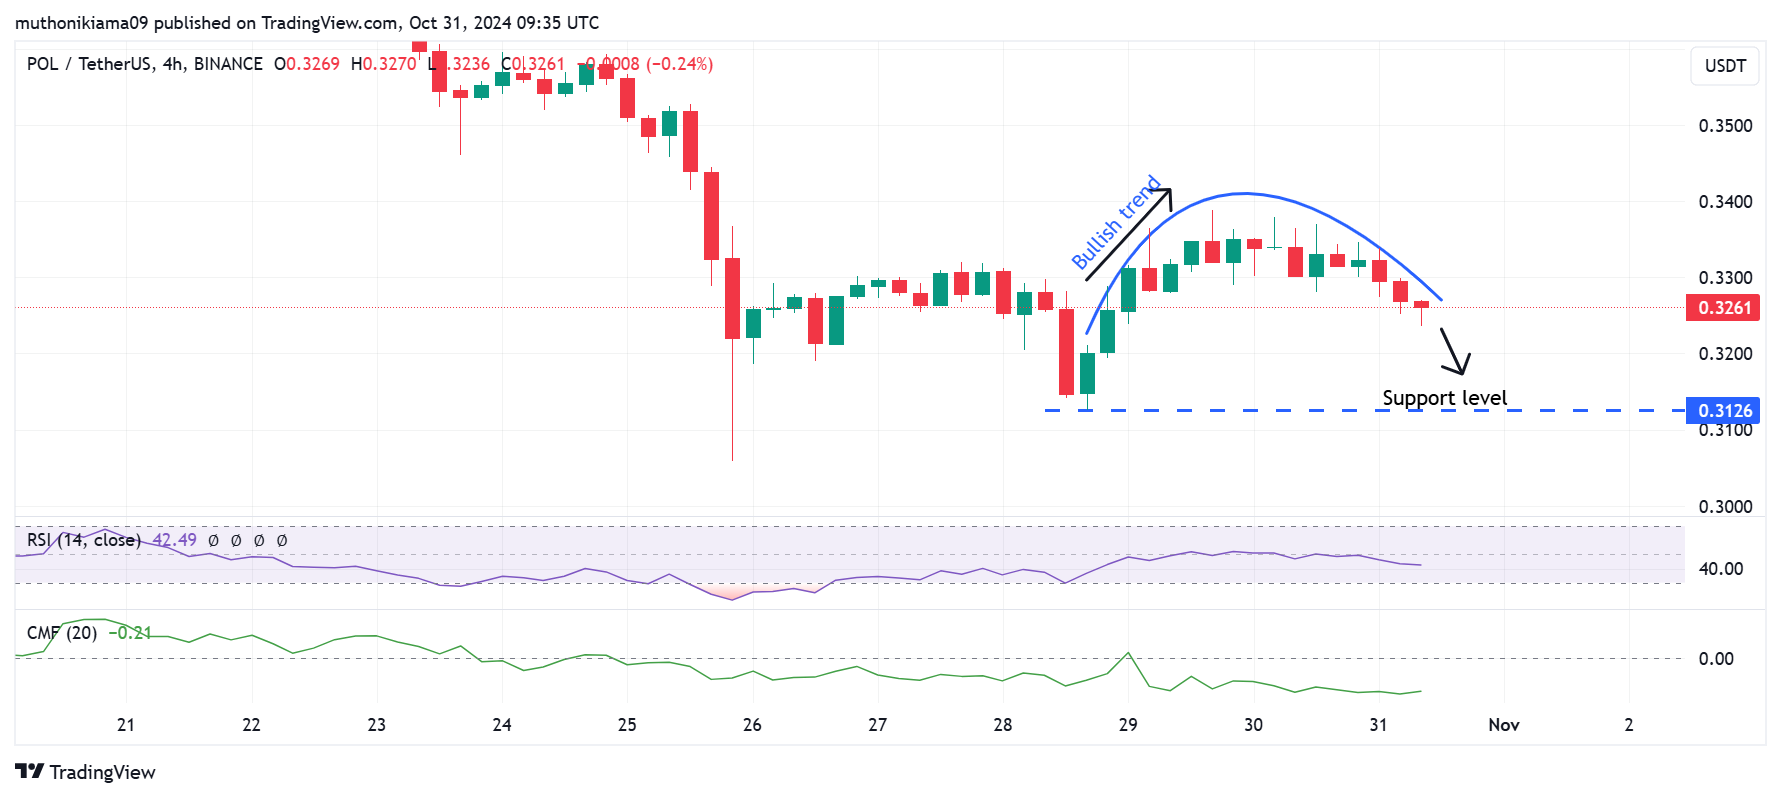
(Source: Tradingview)
Technical indicators suggest new bearish momentum. The Chaikin Money Flow (CMF) has a negative value of -0.21, which indicates that selling pressure is greater than buying pressure.
The Relative Strength Index (RSI), which has a reading of 42, also indicates bearish momentum.
The RSI is also tilting south, indicating that selling activity is increasing. If buyers do not intervene, this further strengthens the bearish thesis around POL.
Data derived from Polygon shows THIS
The derivatives market is showing more bearish signs around POL. Despite the 8% increase in volumes, open interest had fallen 3% to $49 million at press time.
This decline shows that derivatives traders are closing their existing positions in POL.
Reduced market participation also indicates a lack of conviction among traders regarding POL’s future price movements.
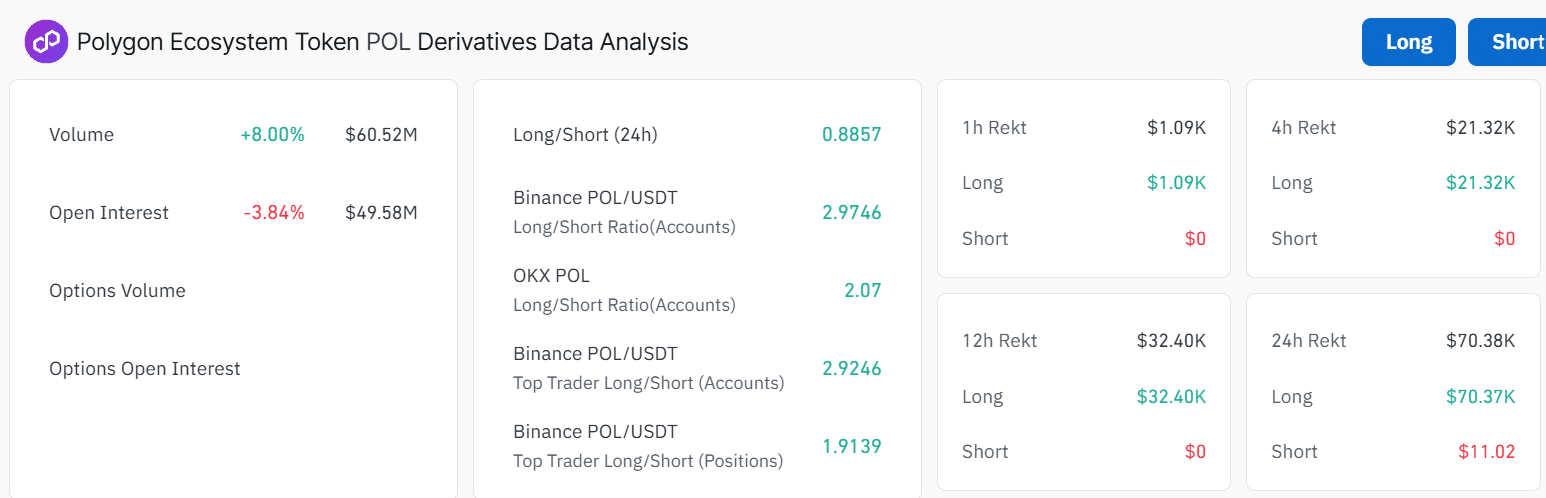
(Source: Coinglass)
The long/short ratio at 0.88 shows that short positions are larger than long positions, further highlighting the bearish sentiment. However, on Binance, there are more traders with long positions than short positions.
Is your wallet green? Check out the POL profit calculator
The bias toward short positions could be attributed to an influx of liquidations. Over the past 24 hours, over 90% of liquidated trades were short positions.
Although the retail market is showing bearish sentiment towards POL, institutions or smart traders remain bullish, according to Market Prophit.

(Source: Market Prophet)