


Three signals are converging on a single Bitcoin price analysis target of $85,000, and for once, they are not pointing in different directions. Research firm Glassnode has identified what analysts call a “triple threat” setup: Bitcoin has surpassed critical on-chain cost basis levels, futures funding rates have moved from negative to neutral, and options market mechanisms are now forcing dealers to hedge in the direction of the rally.
The central question this raises is structural and not speculative. Is this a true multi-signal alignment pointing towards $85,000 BTC – or are these three ways of describing the same momentum move? The data deserves a closer look.
DISCOVER: The Next 1000x Crypto Gem Ahead of Its Listing on Binance
Crypto ETFs and the Institutional Floor Under Bitcoin Rally
The first step in the triple threat is the institutional ETF offering, and it has reshaped Bitcoin’s market structure in a way that matters toward the $85,000 target.
Spot Bitcoin ETFs have absorbed sustained demand from institutional desks that treat minor pullbacks as buying opportunities rather than exit signals.
While cumulative ETF inflows on Wall Street have exceeded $58 billion, the sheer scale of this capital creates a structural floor that retail markets simply do not have.
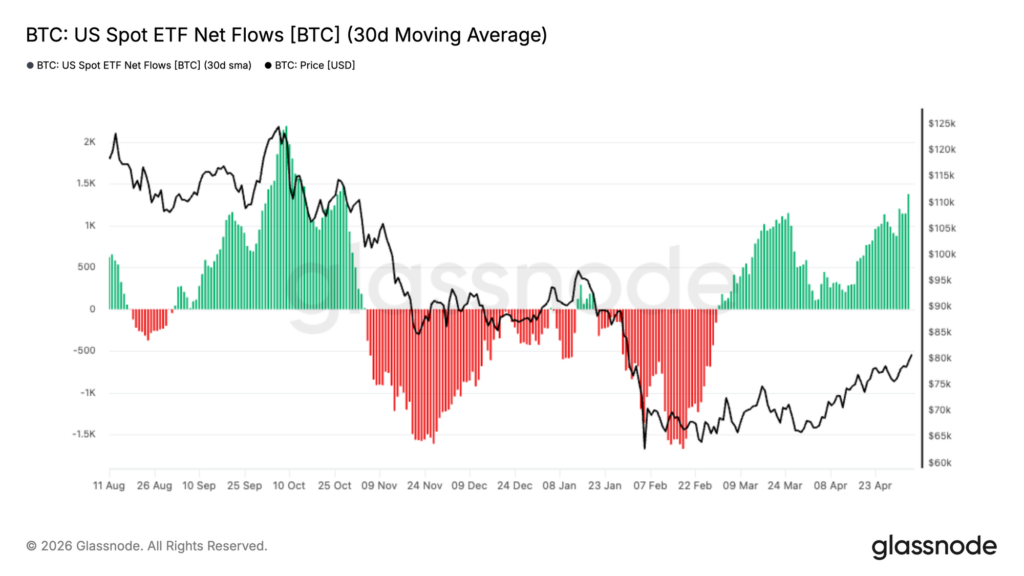
This is how the mechanism works. When institutional offices accumulate via ETF wrappers, these coins leave the liquid supply and remain in custody. Think of it like water draining out of a bathtub: Less available supply at a given price point means sellers have to compete harder to attract buyers.
Bitfinex analysts noted that for most of the past three months, funding rates were negative, meaning hedge funds were performing a popular arbitrage: buying spot Bitcoin or ETFs while simultaneously selling futures contracts. This trade created steady downward pressure on the futures markets even as Bitcoin rallied.
Today, financing rates have become neutral or slightly positive. Bitfinex analysts express this clearly: “The switch to neutrality does not invalidate the carry trade; this indicates that shorts paying for the privilege are no longer present on a large scale.
Either funding becomes negative again as new ETF capital recreates the trade, or the squeeze must continue. The institutional floor is real, but it only holds as long as net flows remain positive. BlackRock’s IBIT accumulation patterns suggest these desks aren’t done buying. This is not a guarantee. This is a structural trend.
DISCOVER: The best Meme Coin ICOs to invest in 2026
Whale hoarding: On-chain data shows who’s actually buying
The second signal comes from on-chain data, and it is the one that most directly informs the Bitcoin for $85,000 technical analysis case.
Glassnode tracks two levels that matter most to active market participants: the true market average at $78,200 – the average price paid by investors whose coins are actually circulating, and the short-term holder cost basis at $79,100, representing what traders who bought in the last six months paid on average.
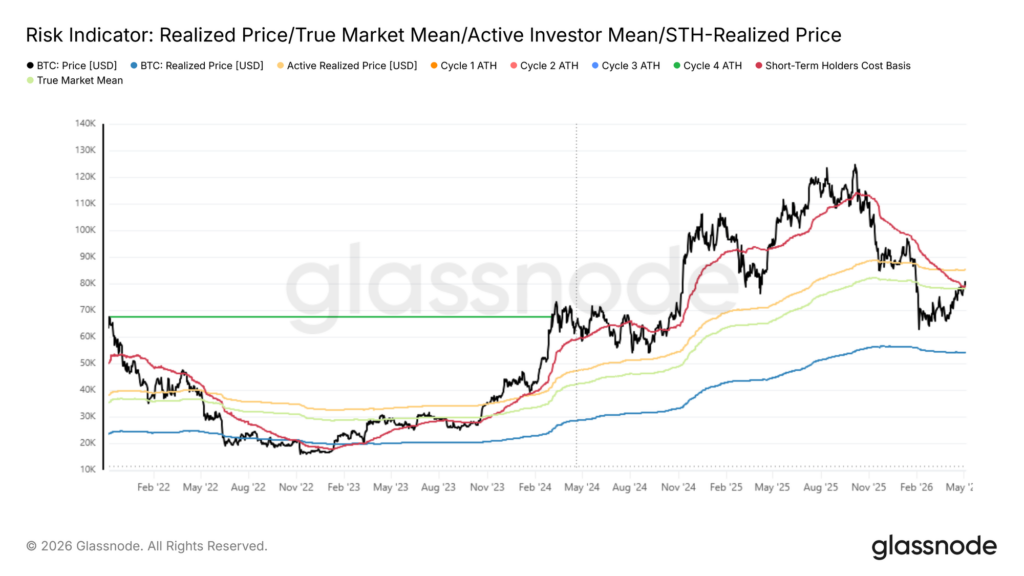
Bitcoin’s simultaneous surpassing of both levels is significant. When the price is below these thresholds, most active holders are underwater, sentiment deteriorates, and selling pressure increases. When the price exceeds them, the same holders make profits, thereby reducing their urgency to sell and compressing the available supply.
Glassnode analysts noted: “If the price were to sustain above these two levels over the coming week, the deep value regime that has persisted since early February 2026 until today would rank among the shortest such episodes in Bitcoin market history. »
Whale accumulation patterns reinforce this picture. Large wallet buyers – addresses holding a significant amount of BTC that institutional and wealthy participants control, appear to have absorbed a supply of between $75,000 and $79,000 during the correction.
Coins that leave exchanges and are held for the long term are the fingerprint of this on-chain behavior. Glassnode identifies the next major structural level as the realized active price near $85,200, which tracks the cost basis of all non-dormant supply. “Focus now shifts to the next major resistance at the realized active price near $85.2k,” Glassnode analysts said, “which represents the next structural threshold the market must reckon with.”
Bitcoin technical analysis: the options mechanism that could force $85,000
The third signal is the most technical – and arguably the most powerful in the short term. Options market makers currently have short gamma exposure of around $2 billion, clustered around the $82,000 level, according to Glassnode.
If this framework seems abstract, here’s the plain English version: These traders are positioned in a way that requires them to buy Bitcoin as its price rises, in order to remain hedged.
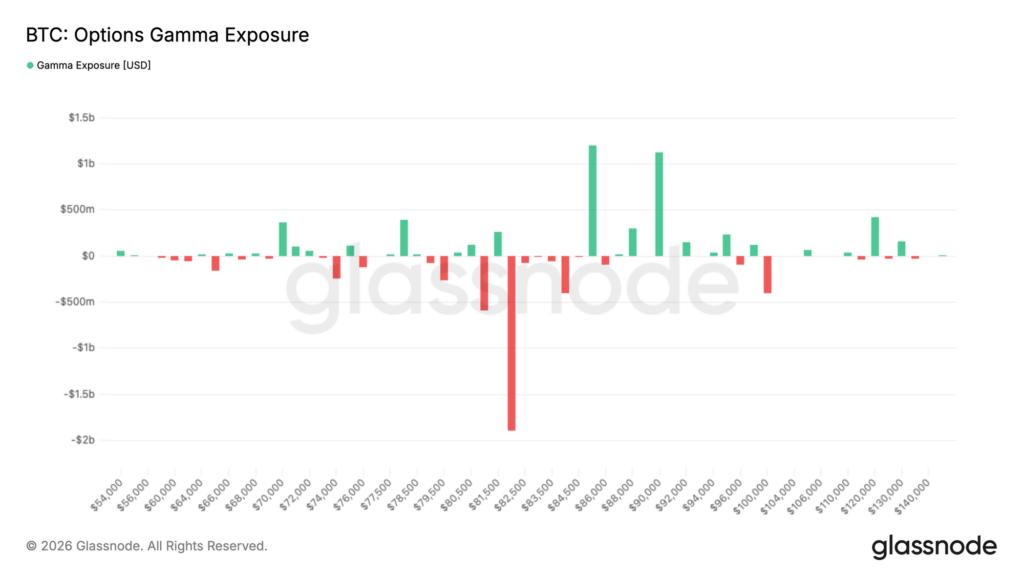
Glassnode described the feedback loop directly: “Short gamma means that dealers are positioned in a way that forces them to hedge in the direction of the move, buying when the price rises and selling when it falls. This creates a feedback loop that can accelerate price action, which helps explain the recent push toward $83,000.”
Think of it like a crowded escalator: once momentum starts, each additional step upward unintentionally attracts more participants.
This mechanism works symmetrically in the opposite direction. If Bitcoin declines from current levels, these same traders will likely hedge by selling, adding to the downward pressure. The options setup amplifies whatever direction the market moves; it does not create direction on its own.
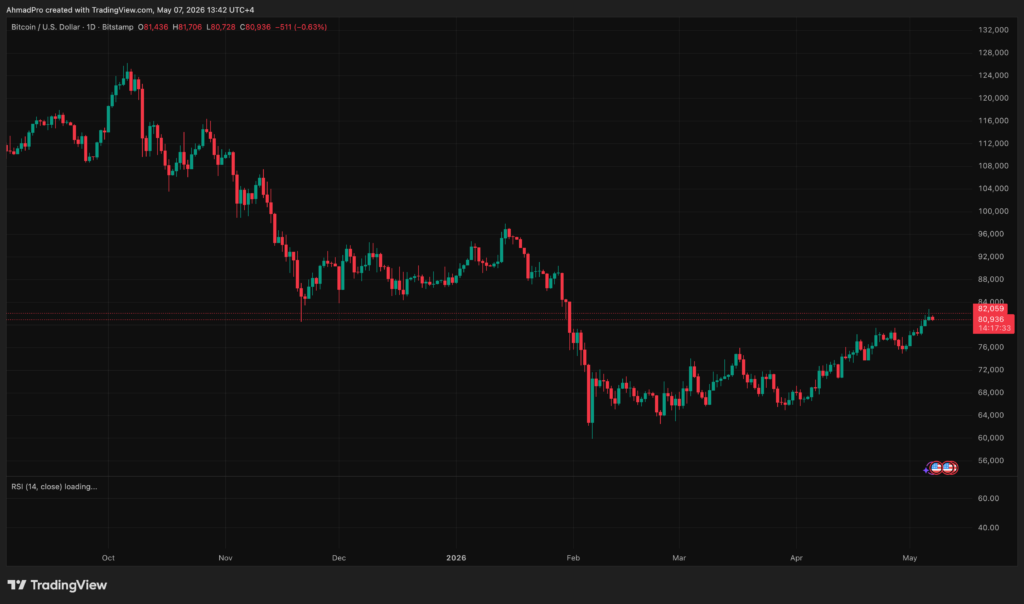
Recent technical analysis of Bitcoin targeting $86,000 highlighted similar RSI and momentum dynamics on the daily and weekly time frames, which is consistent with the confluence picture currently forming.
Bitcoin price analysis: three scenarios: where is Bitcoin going from $80,000?
The BTC setup is constructive as multiple signals align at once: ETF inflows, whale accumulation above key cost base levels, and dealer positioning mechanisms. Only one signal can fail. Three lined up together counts more.
At present, the key levels are clear.
As long as BTC holds above around $78.2k to $79.1k, the bullish structure remains intact and keeps the path open towards $82k and potentially $85.2k.
This $85.2k area is the real level to watch. A confirmed move above this level would signal a major structural change and has historically led to stronger extensions in past cycles.
More likely in the short term, BTC consolidates between $80,000 and $83,000 while the market works through funding and positioning.
Risk is always macro. Bitcoin remains closely tied to stocks, so strong risk aversion in the tech sector could quickly turn things around.
If BTC loses $78.2k, the structure quickly weakens and the decline towards $75k – $76k opens up again.
It is therefore a mechanically bullish configuration, but also fragile. The same positioning forces that can accelerate the rise can accelerate the decline if support breaks.
The article Bitcoin Price Analysis: BTC eyes $85,000, Understanding the ‘triple threat’ behind the price target appeared first on 99Bitcoins.