





Ethereum is losing momentum after breaching the $1,900 mark – a level that was the last significant support before the price structure entered territory not seen since the depths of the previous cycle. Distribution matters – and a CryptoOnchain analysis has identified a structural divide in on-chain data that explains the current weakness in a more nuanced way than simple selling pressure.
The divide is between Ethereum’s illiquid and liquid supply layers – and they are moving in opposite directions simultaneously. The staking ecosystem continues to expand, with over 32.5% of the total ETH supply now dedicated to validator infrastructure, or approximately 39.5 million ETH locked in staking contracts. This record commitment reflects a cohort of long-term holders whose conviction has not wavered despite the price decline.
Faced with this growing illiquid base, the liquidity layer contracts. Foreign exchange reserves are decreasing. The Coinbase Premium Index remains deeply negative relative to its 90-day average, confirming that U.S. institutional spot demand has not returned to absorb the supply reaching the market. The median value of on-chain transfers fell approximately 96% below the 90-day benchmark – an almost complete retreat from the small, routine transaction activity that characterizes a healthy and engaged network.
The picture drawn by CryptoOnchain is not that of panic selling. This is a structural disengagement – and Binance stablecoin net flow data averaging -$64 million per day confirms that the purchasing power needed to reverse this disengagement is depleting rather than growing.
32 million ETH staked and locked
CryptoOnchain analysis adds the dimension of derivatives which prevents current weakness from being interpreted as a simple bearish confirmation. Binance funding rates have surged more than 3,700% above their 90-day average, while open interest has increased by almost 9% – numbers that generally suggest that aggressive bearish speculation results in lower prices. Short-term liquidation data completely contradicts this interpretation. Short liquidations on exchanges have fallen by 85% and remain near zero.

Ethereum Funding Rates - Binance | Source: CryptoQuant
This absence is the signal. Distribution phases and aggressive bear cycles are typically characterized by high short-selling activity, as traders pile into positions betting against weakening prices. The current environment shows the opposite: funding rates are high and open interest is increasing without the short liquidation activity that would confirm that bearish speculation is driving the movement. The weakness appears to be due to actual spot sales rather than pressure from derivatives.
The structural conclusion reached by the analysis follows from the combined image. Ethereum is entering a phase where its staked and illiquid supply becomes increasingly detached from short-term market behavior. As more than a third of the total supply is removed from active circulation and the liquid market continues to contract, the free float available for trading decreases.
If spot selling pressure exhausts without triggering a cascade of derivative liquidations—which near-zero short liquidation data suggests remains possible—continued liquidity supply contraction creates the conditions historically associated with sharper, more constrained market responses to the return of demand.
Ethereum price tests major support after losing $2,000
Ethereum remains under significant pressure after decisively losing the psychological $2,000 level and falling below the group of moving averages that had supported the recovery in April and May. The daily chart shows a clear deterioration in market structure, with ETH now trading near $1,885 after briefly falling towards the $1,800 support zone.
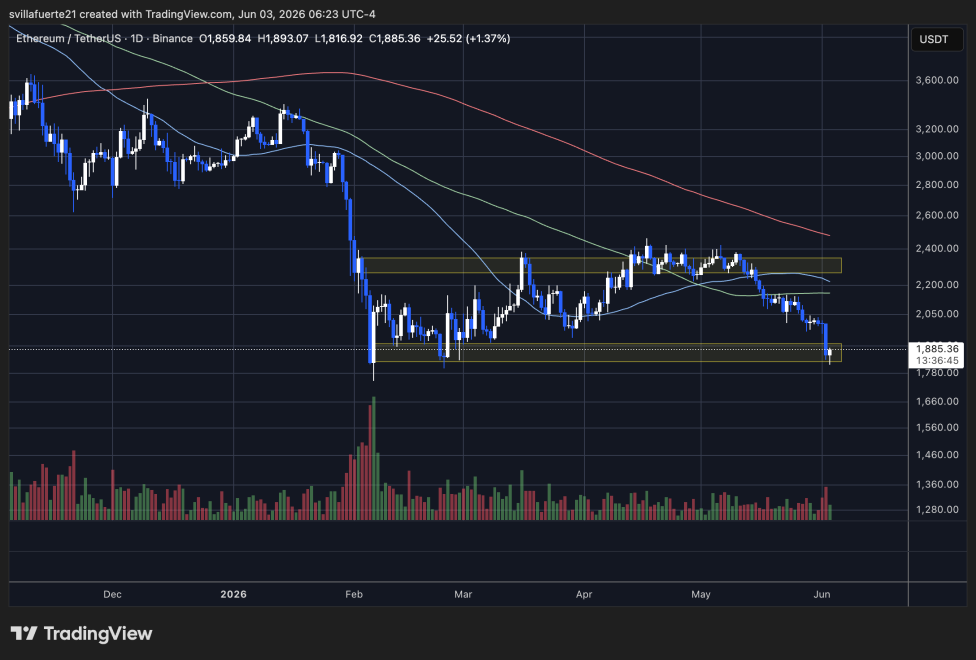
Ethereum consolidates around critical support | Source: ETHUSDT chart on TradingView
The most significant development is the rejection of the $2,250-$2,350 resistance region. This area has limited all recovery attempts over the past two months and ultimately triggered the current decline. Since then, ETH has fallen below the 50-day and 100-day moving averages, while the 200-day moving average near $2,500 continues to decline, confirming that the broader trend remains bearish.
The $1,800-$1,850 zone is now the critical zone to watch. This region acted as a major accumulation area after the February capitulation event and is currently attracting buyers again, as evidenced by the long lower wick and rebound visible on the last candle. However, volume did not increase significantly during the rebound, suggesting that conviction remains limited.
If bulls manage to defend this support and reclaim $2,000, Ethereum could attempt another push towards the $2,200 zone. Failure to sustain the price above $1,800 would invalidate the current range structure and expose the market to a deeper retracement to levels not seen since the first quarter. For now, ETH remains engaged in a decisive battle between long-term support and persistent selling pressure.
Featured image from ChatGPT, chart from TradingView.com
Editorial process as Bitcoinist focuses on providing thoroughly researched, accurate and unbiased content. We follow strict sourcing standards and every page undergoes careful review by our team of top technology experts and seasoned editors. This process ensures the integrity, relevance and value of our content to our readers.


